What 1.3 million conversations say about the state of mental health in America.
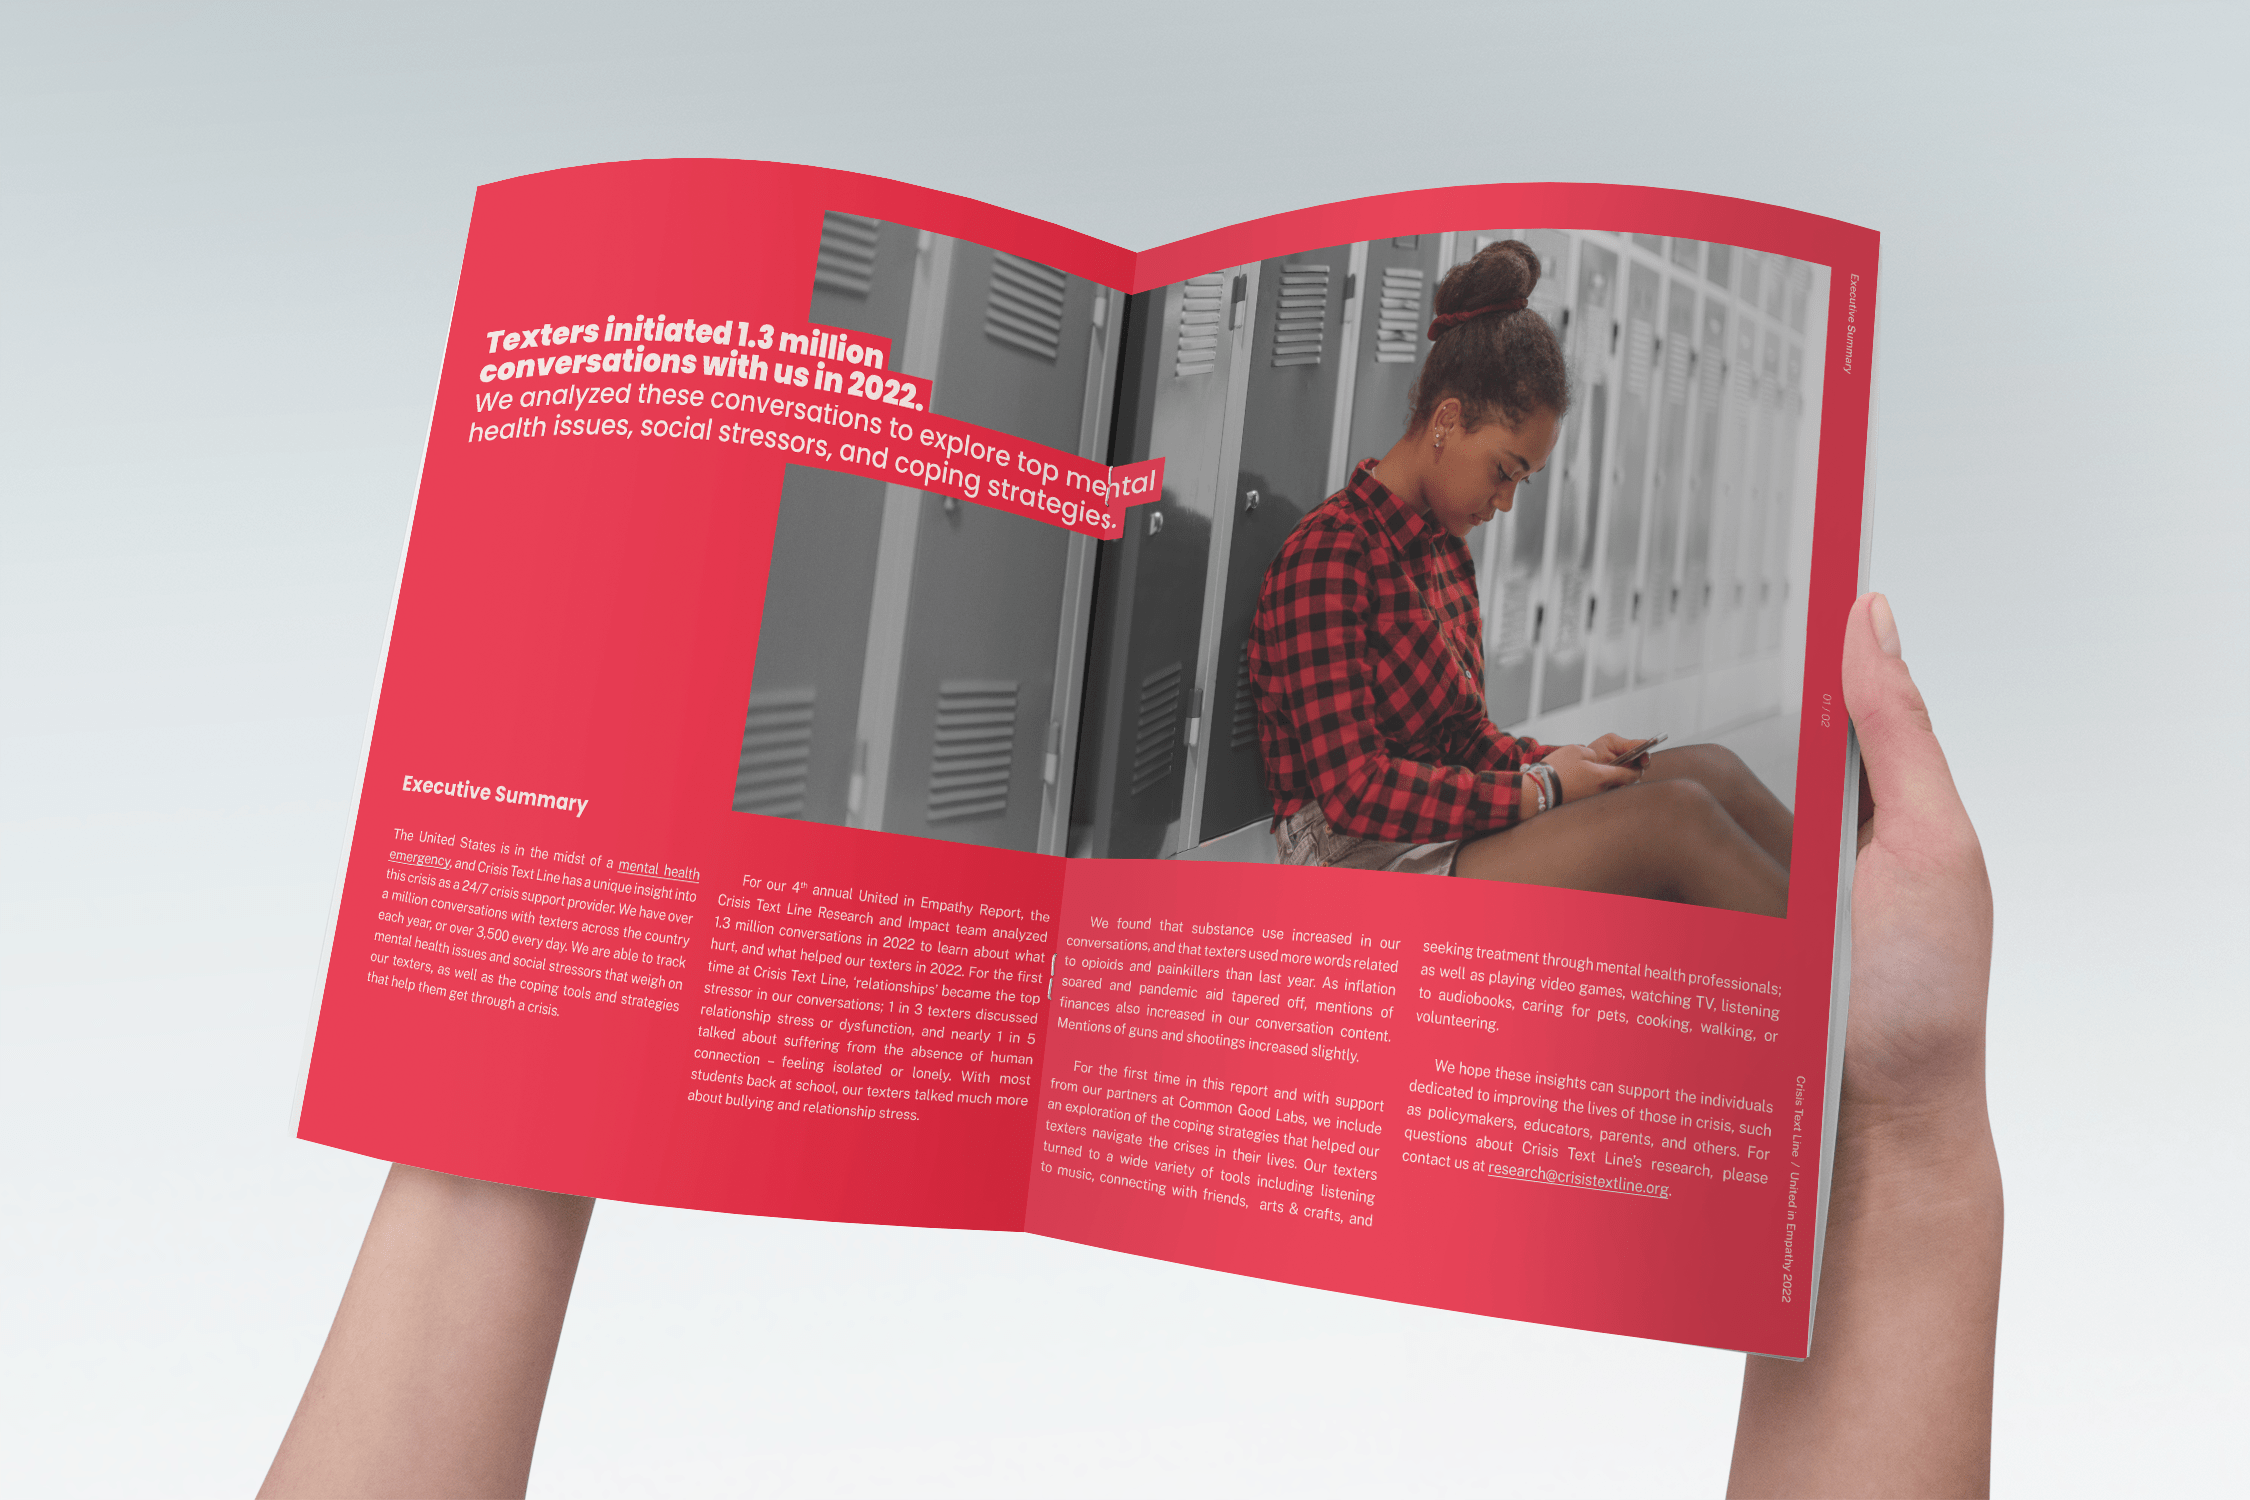
For 2023, my goal was to craft a visually compelling and emotionally resonant document that captures the essence of our findings from over 1.3 million conversations with individuals in crisis. The report sheds light on significant mental health trends, highlighting the primary stressors and coping mechanisms prevalent in today’s society.
Brand
Crisis Text Line
Year
2023
Role
Senior Creative Director
Category
Infographics
Print
Creative vision
⸺ Emotional Engagement
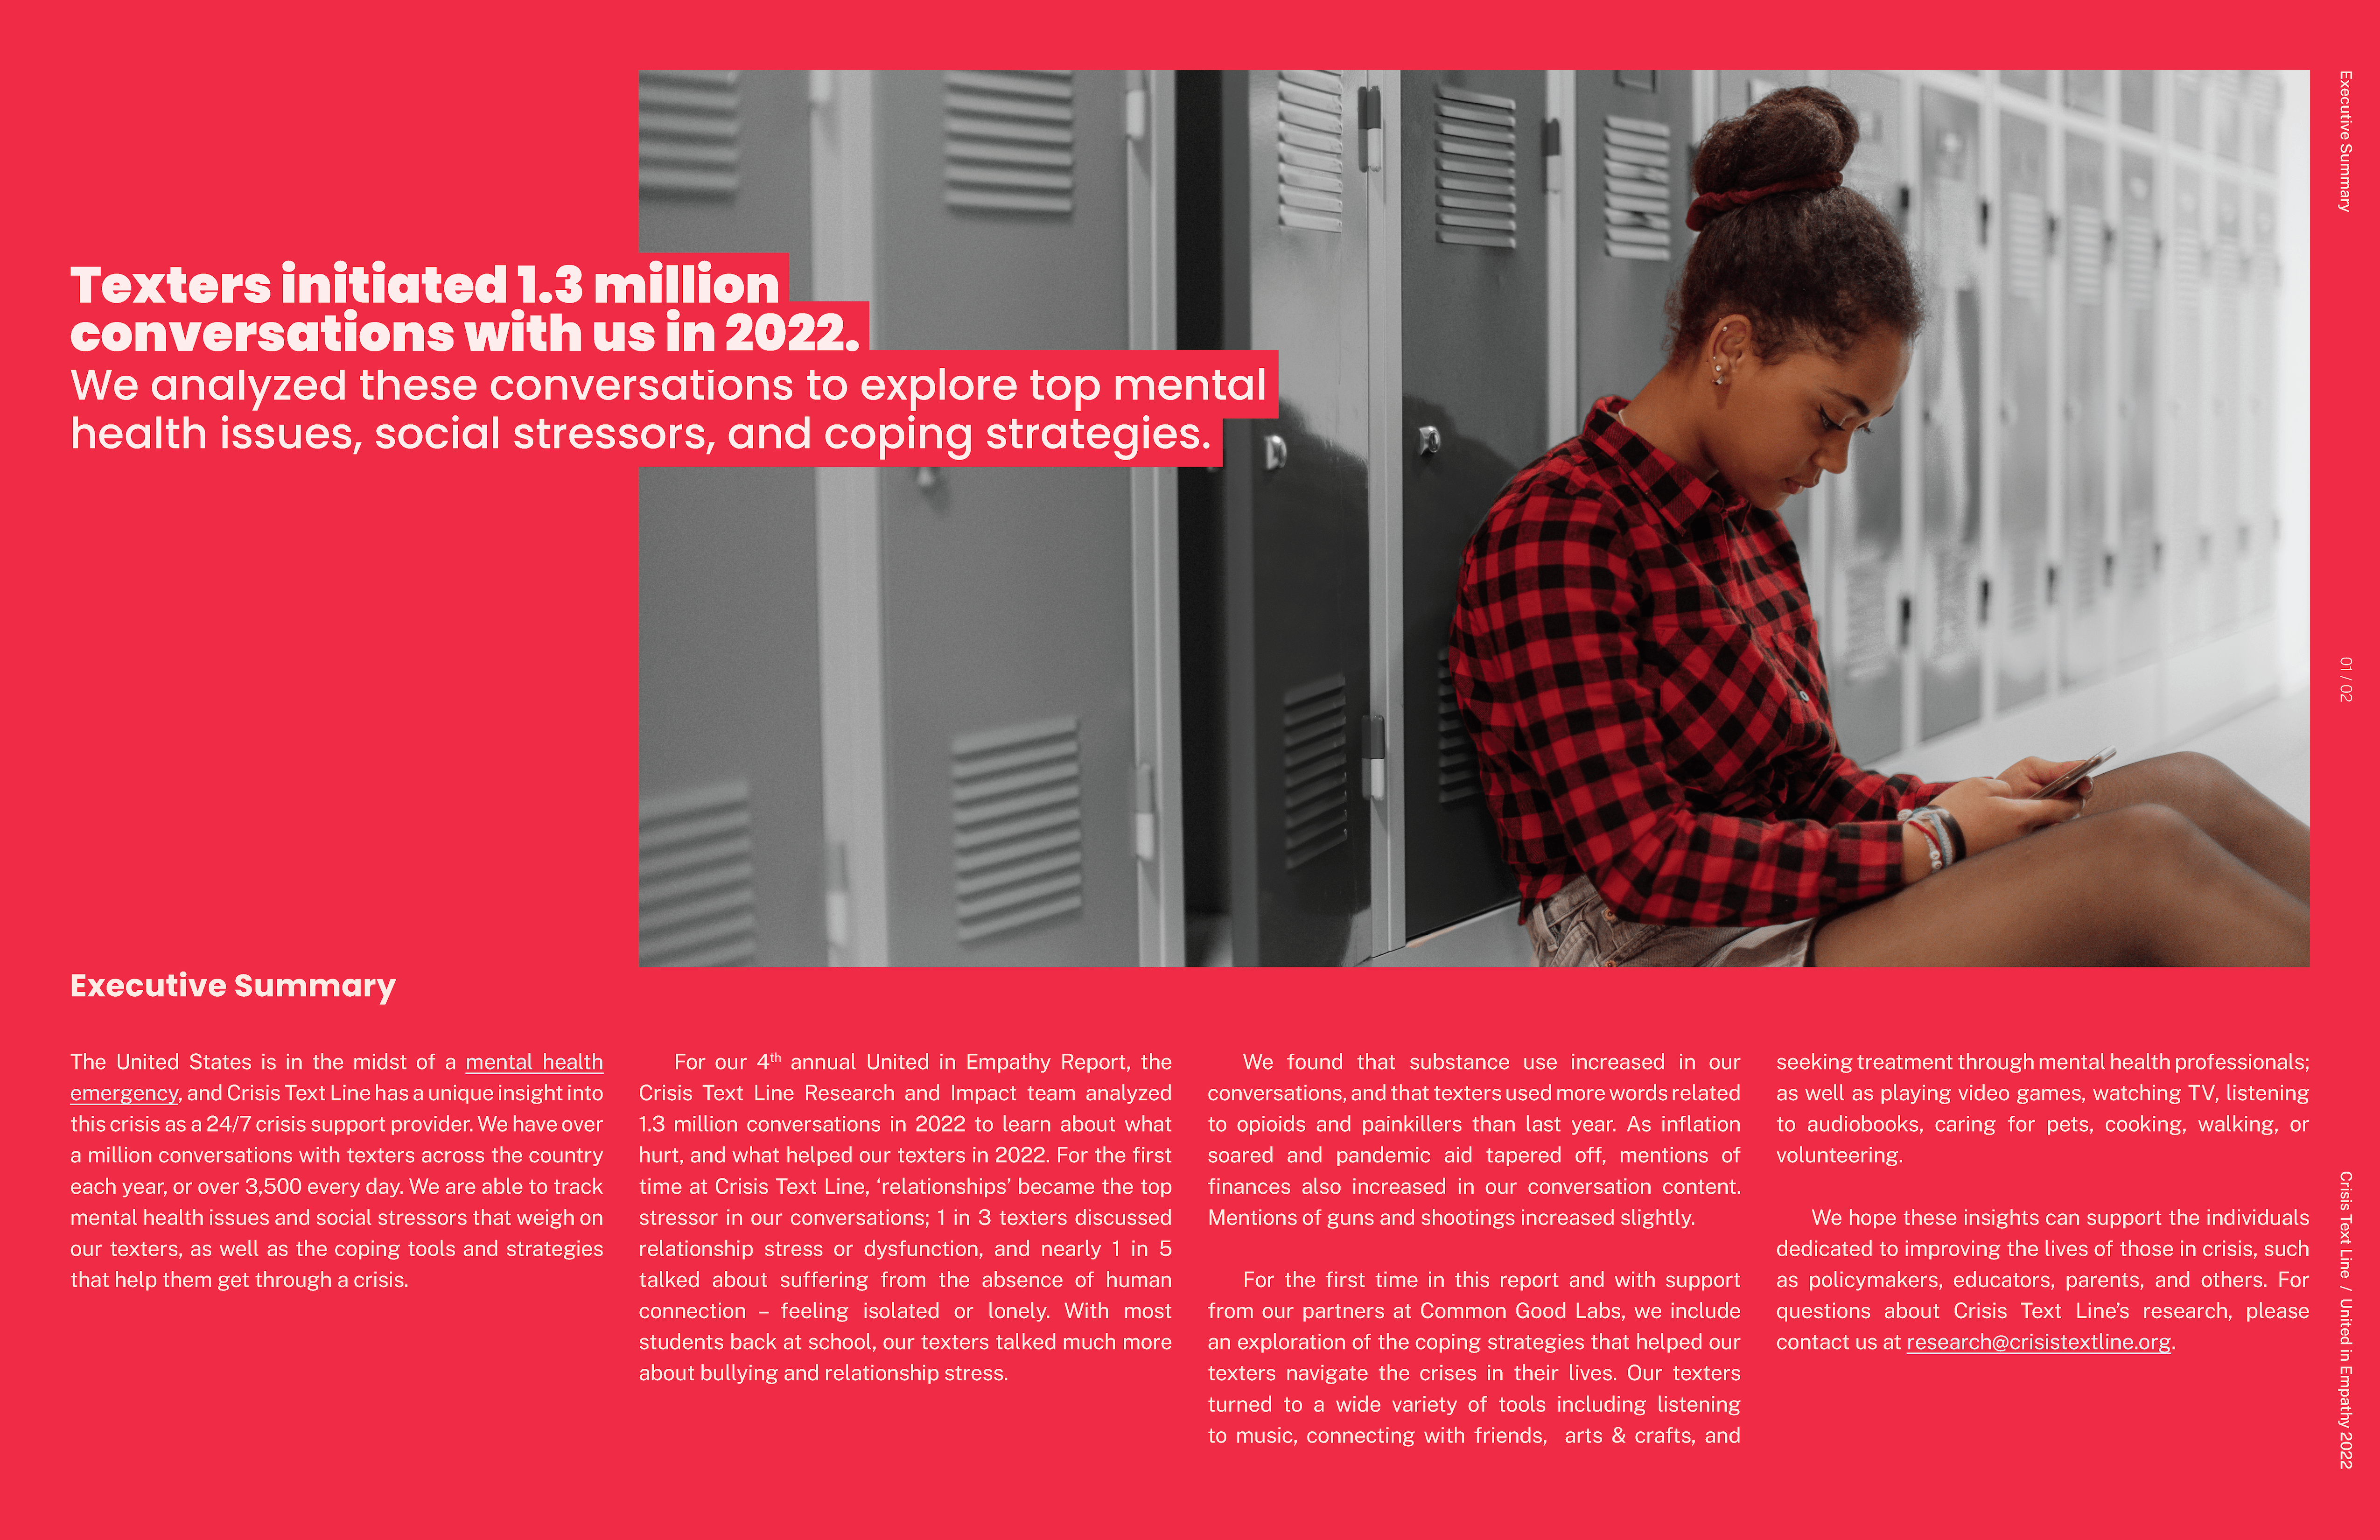
The report needed to connect with readers on an emotional level. I aimed to create a visual and narrative experience that not only presents data but also tells the heartfelt stories behind the numbers. This was achieved through a careful selection of imagery, colors, and design elements that evoke empathy and understanding.
⸺ Data Storytelling
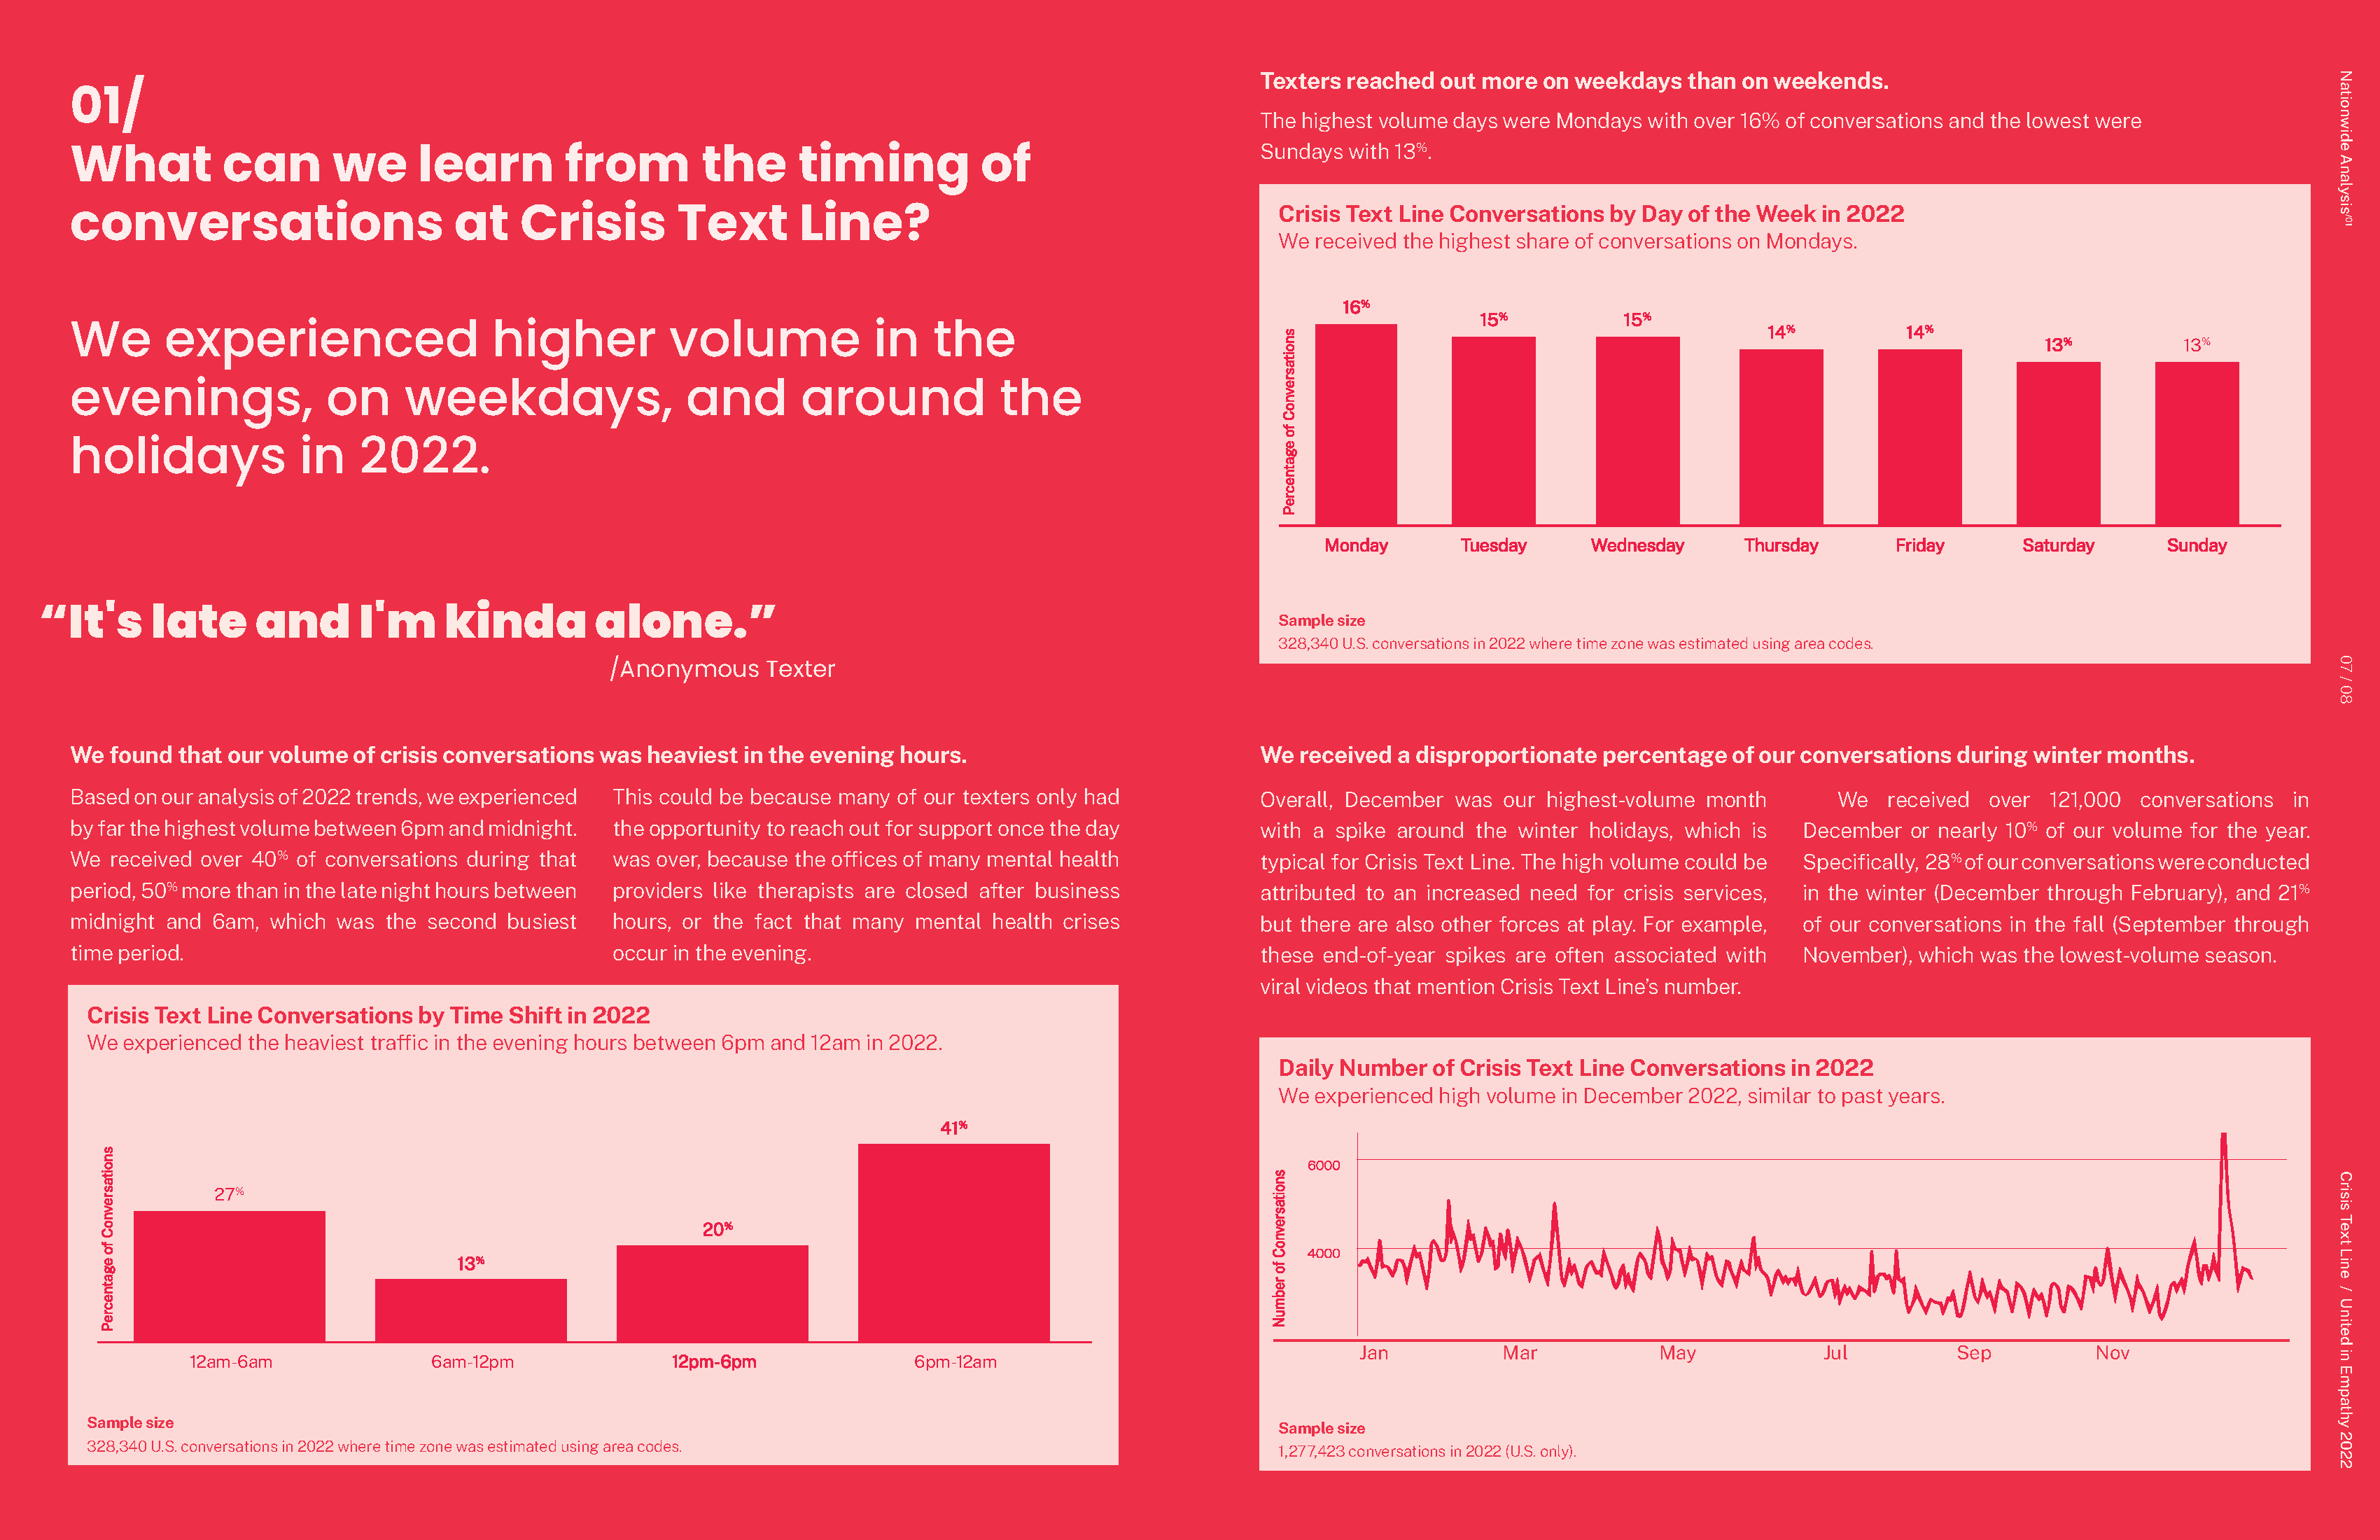
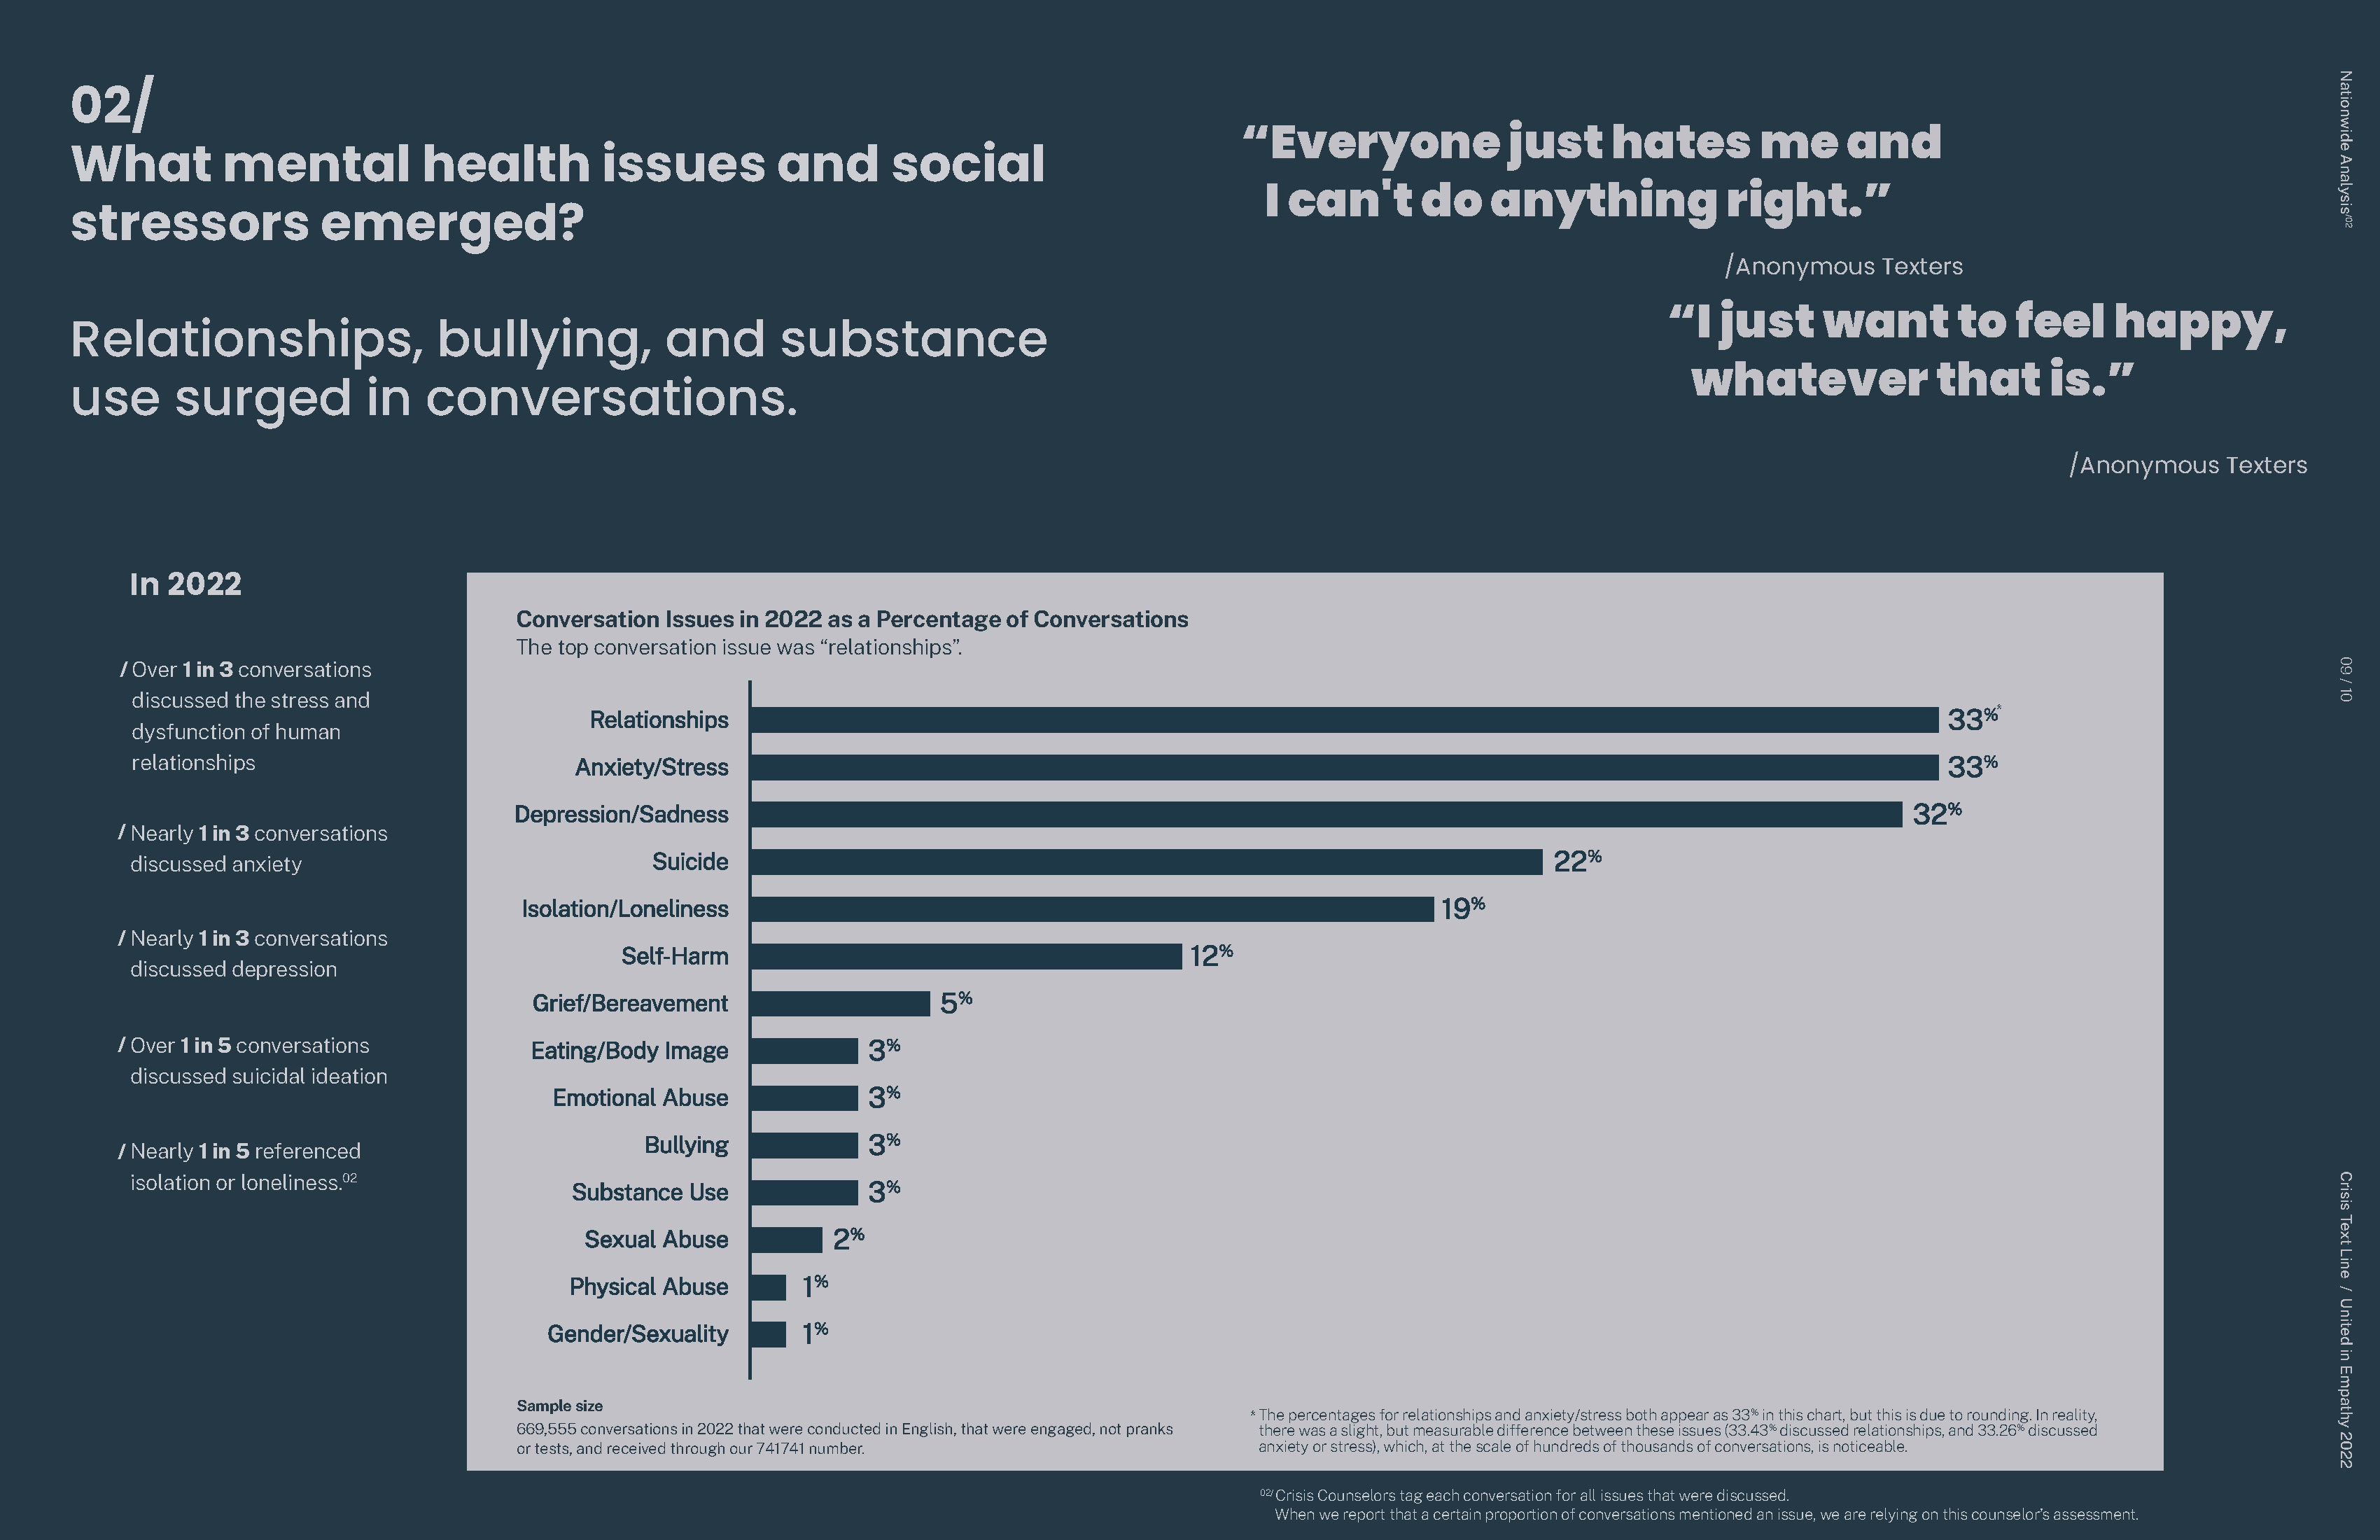
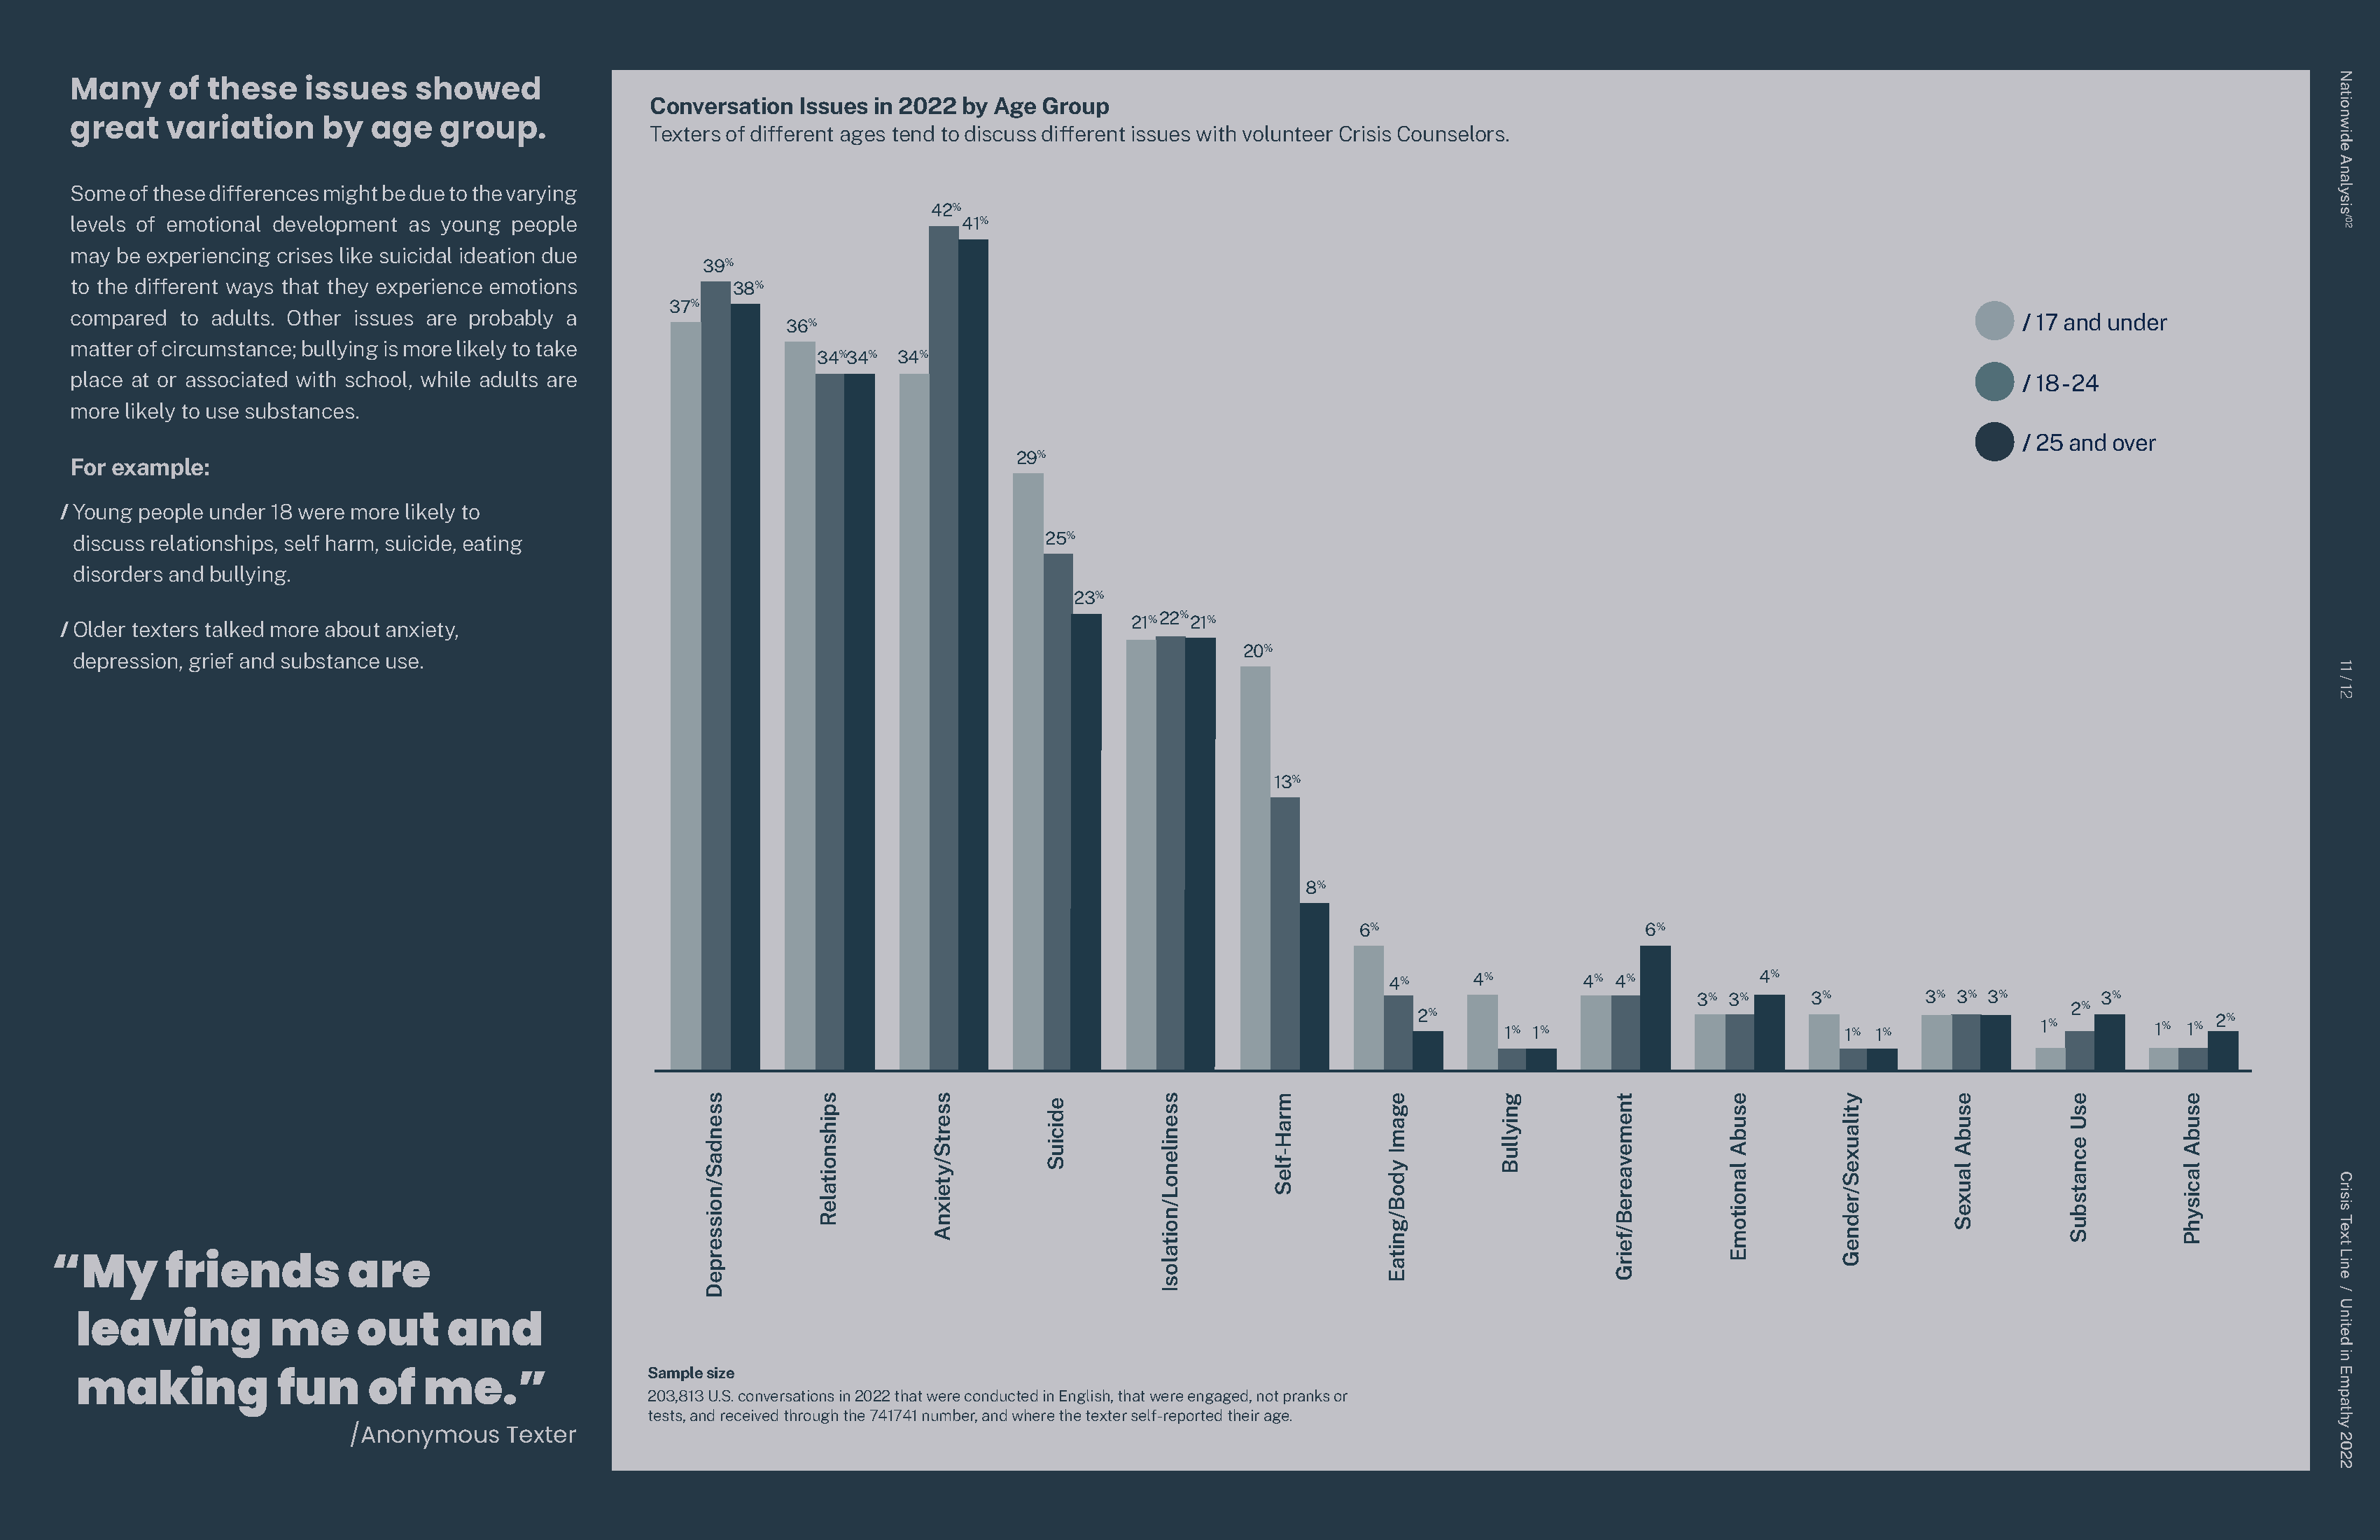
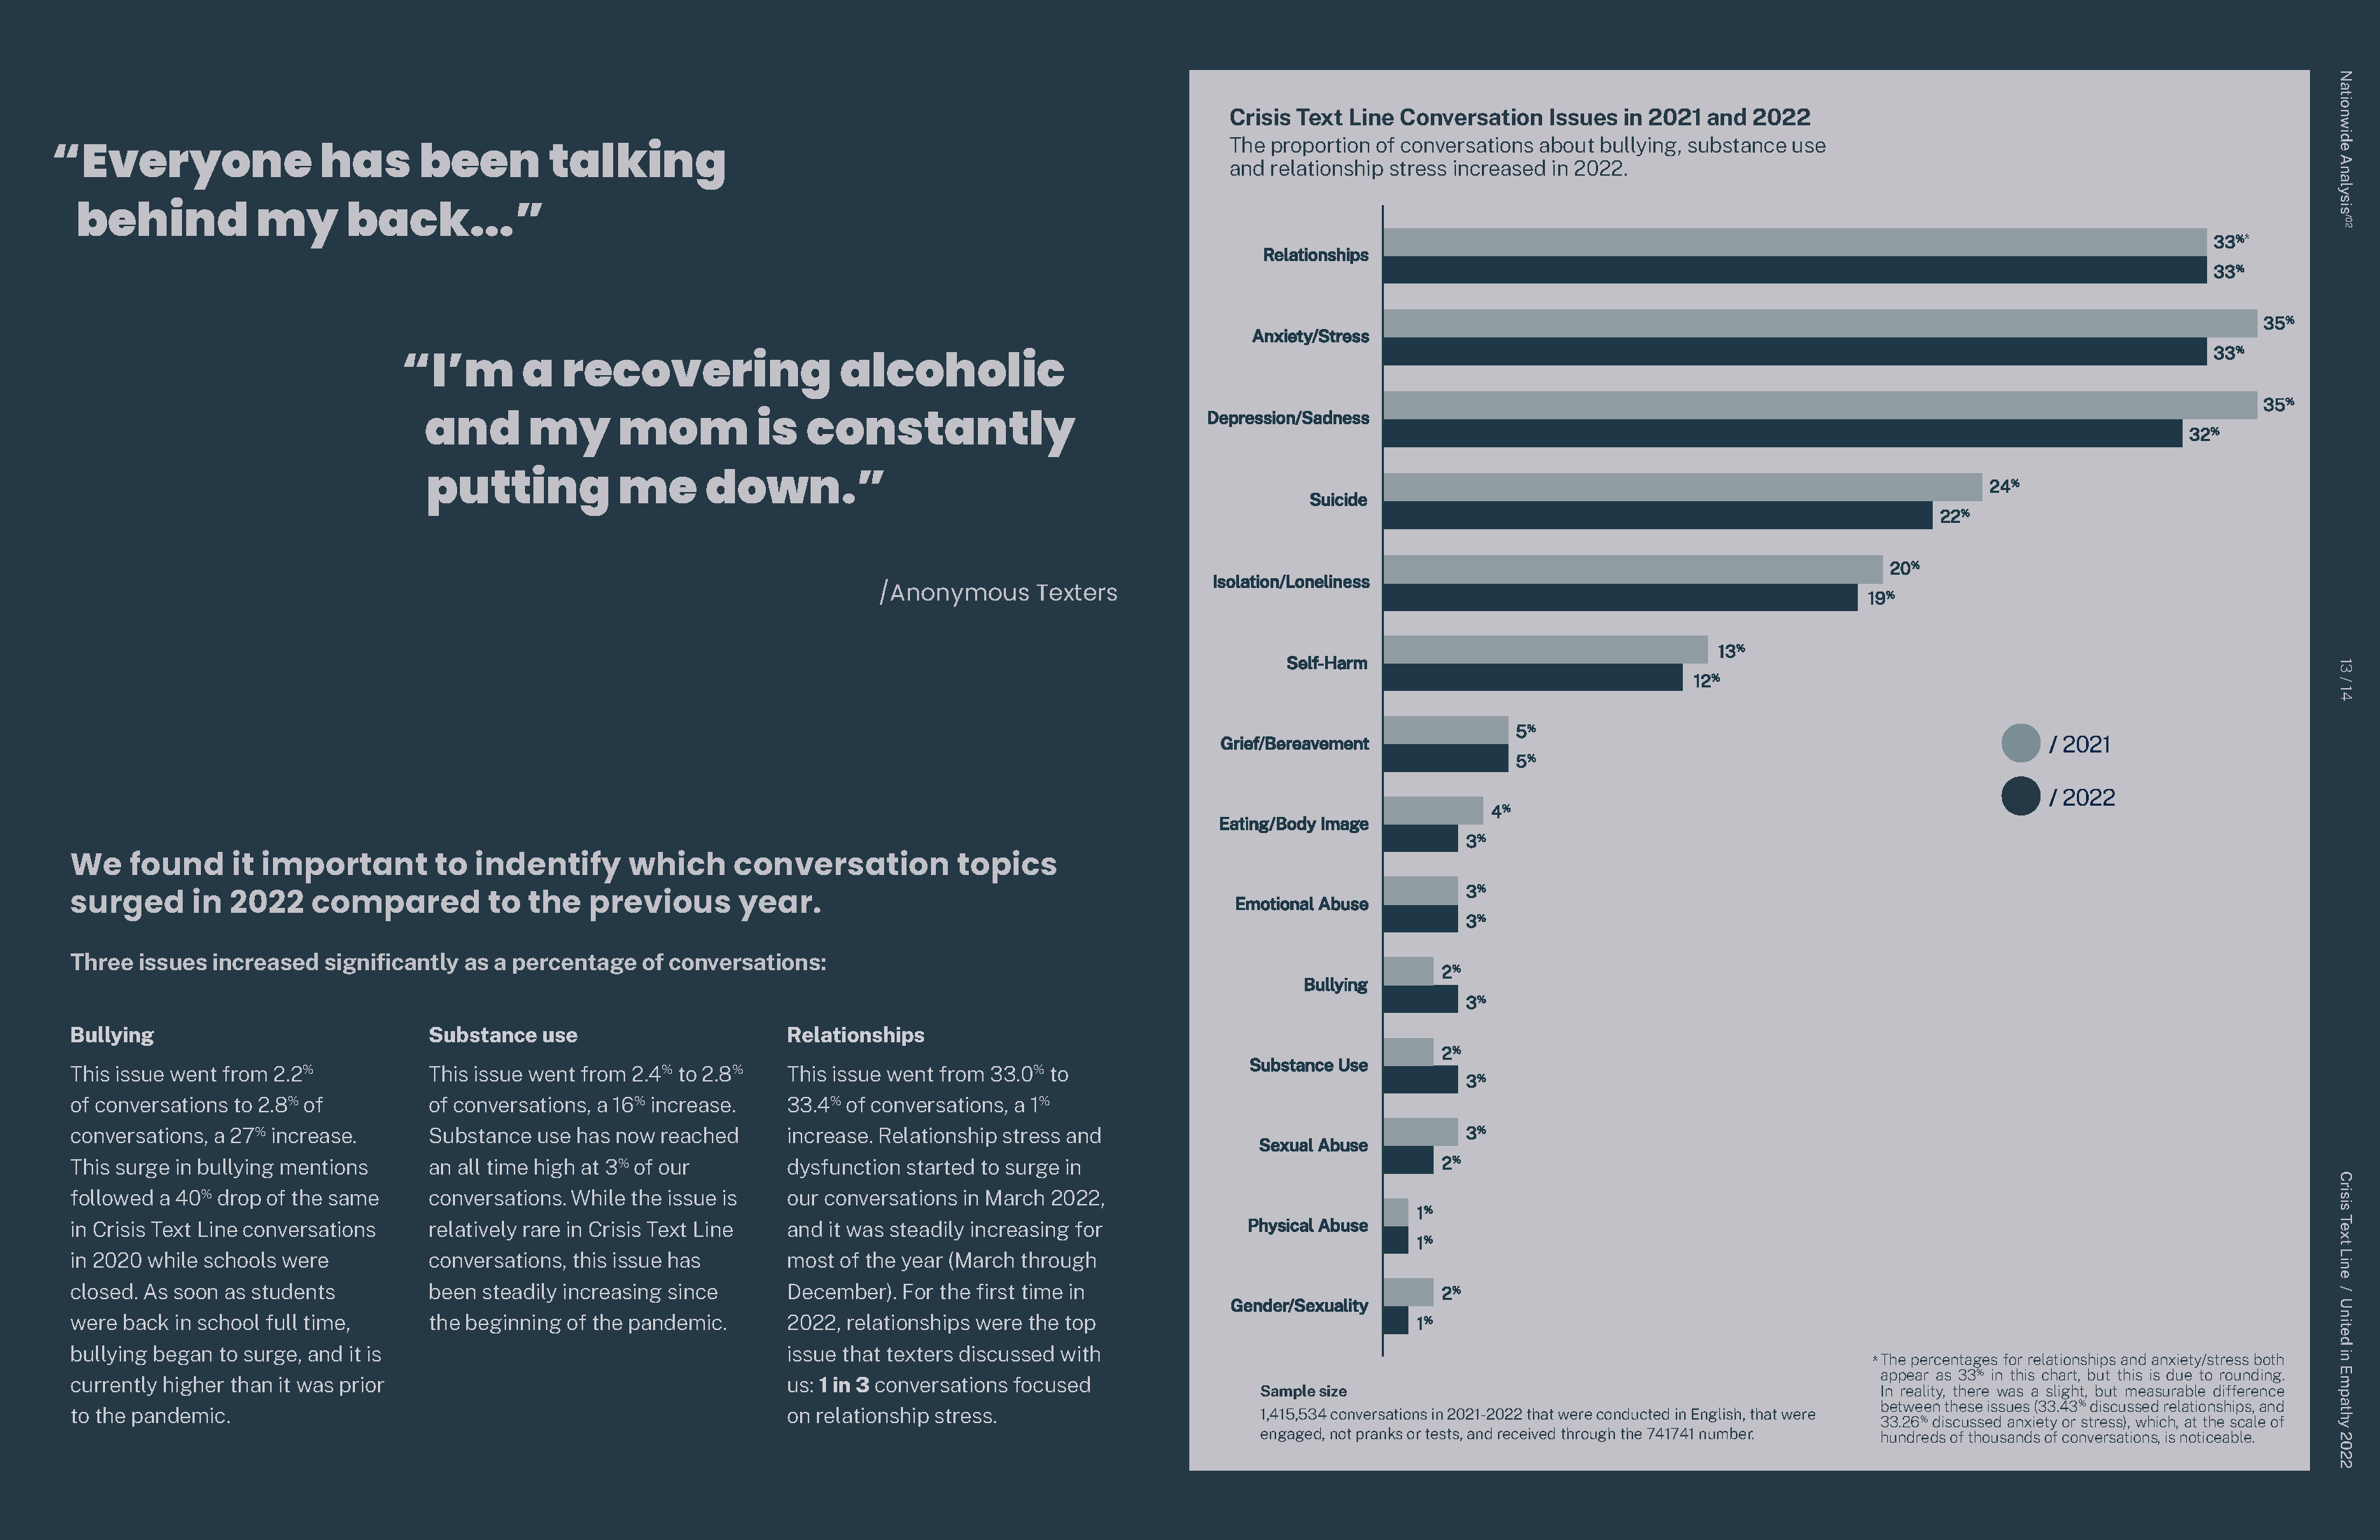
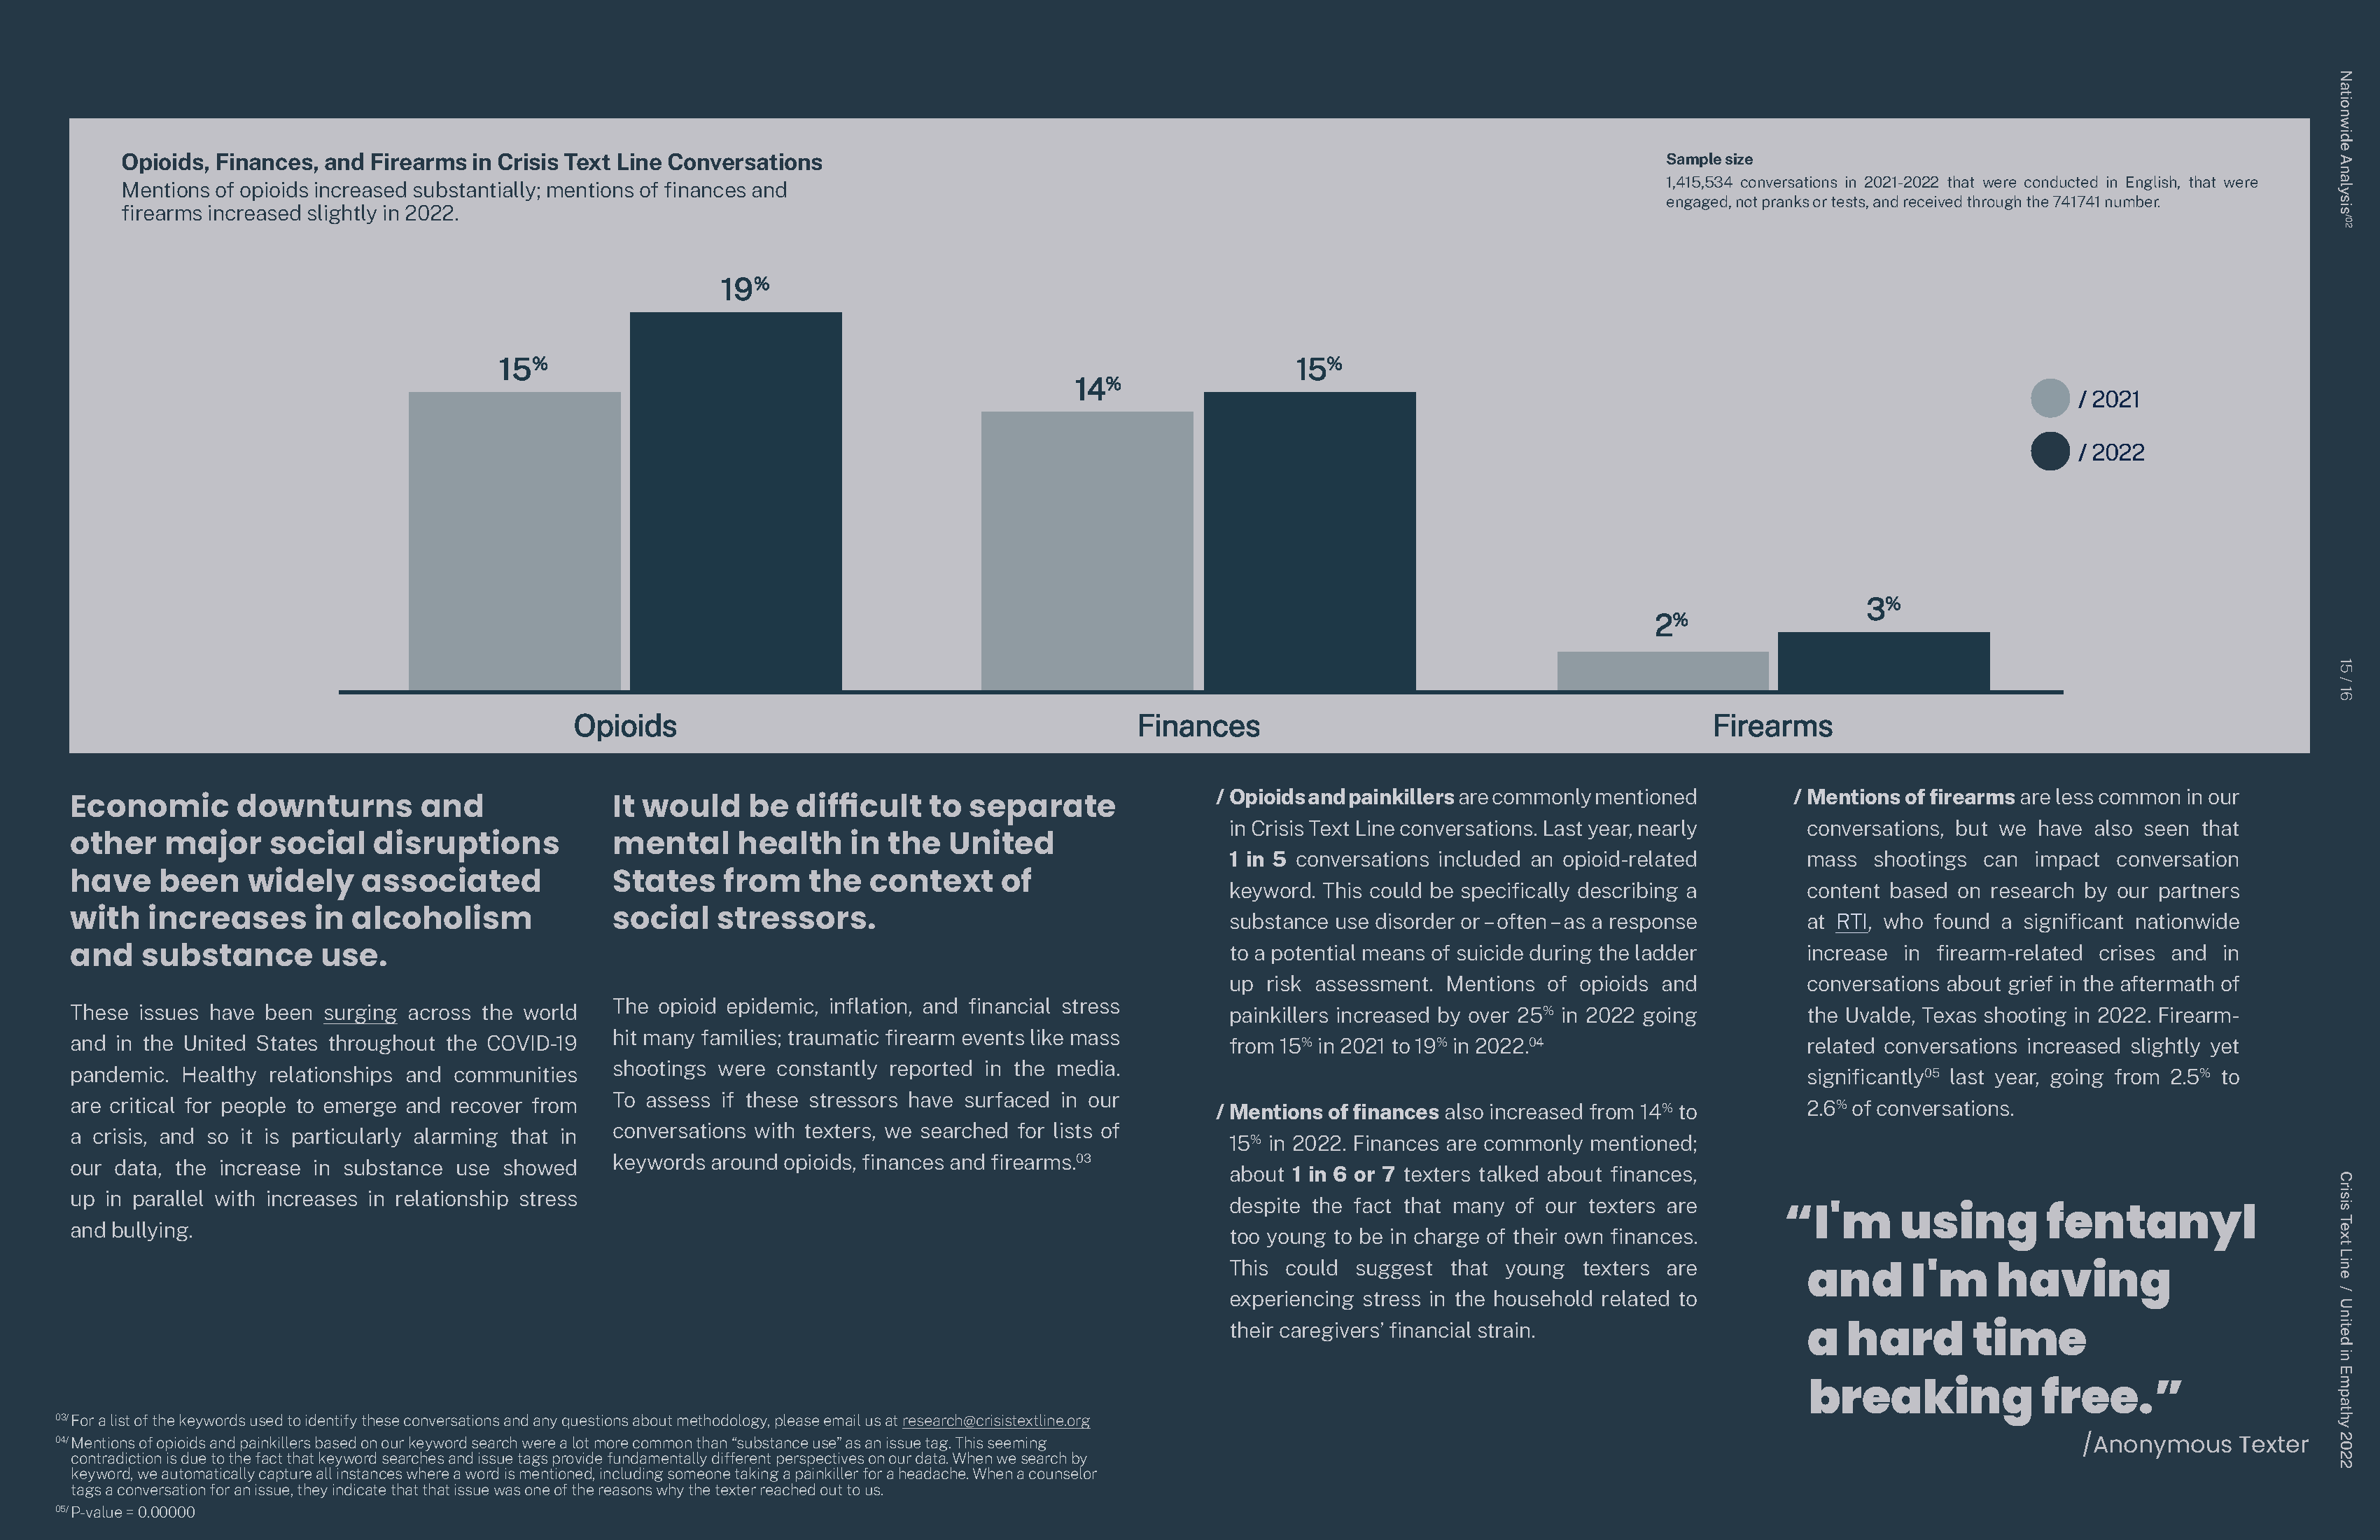
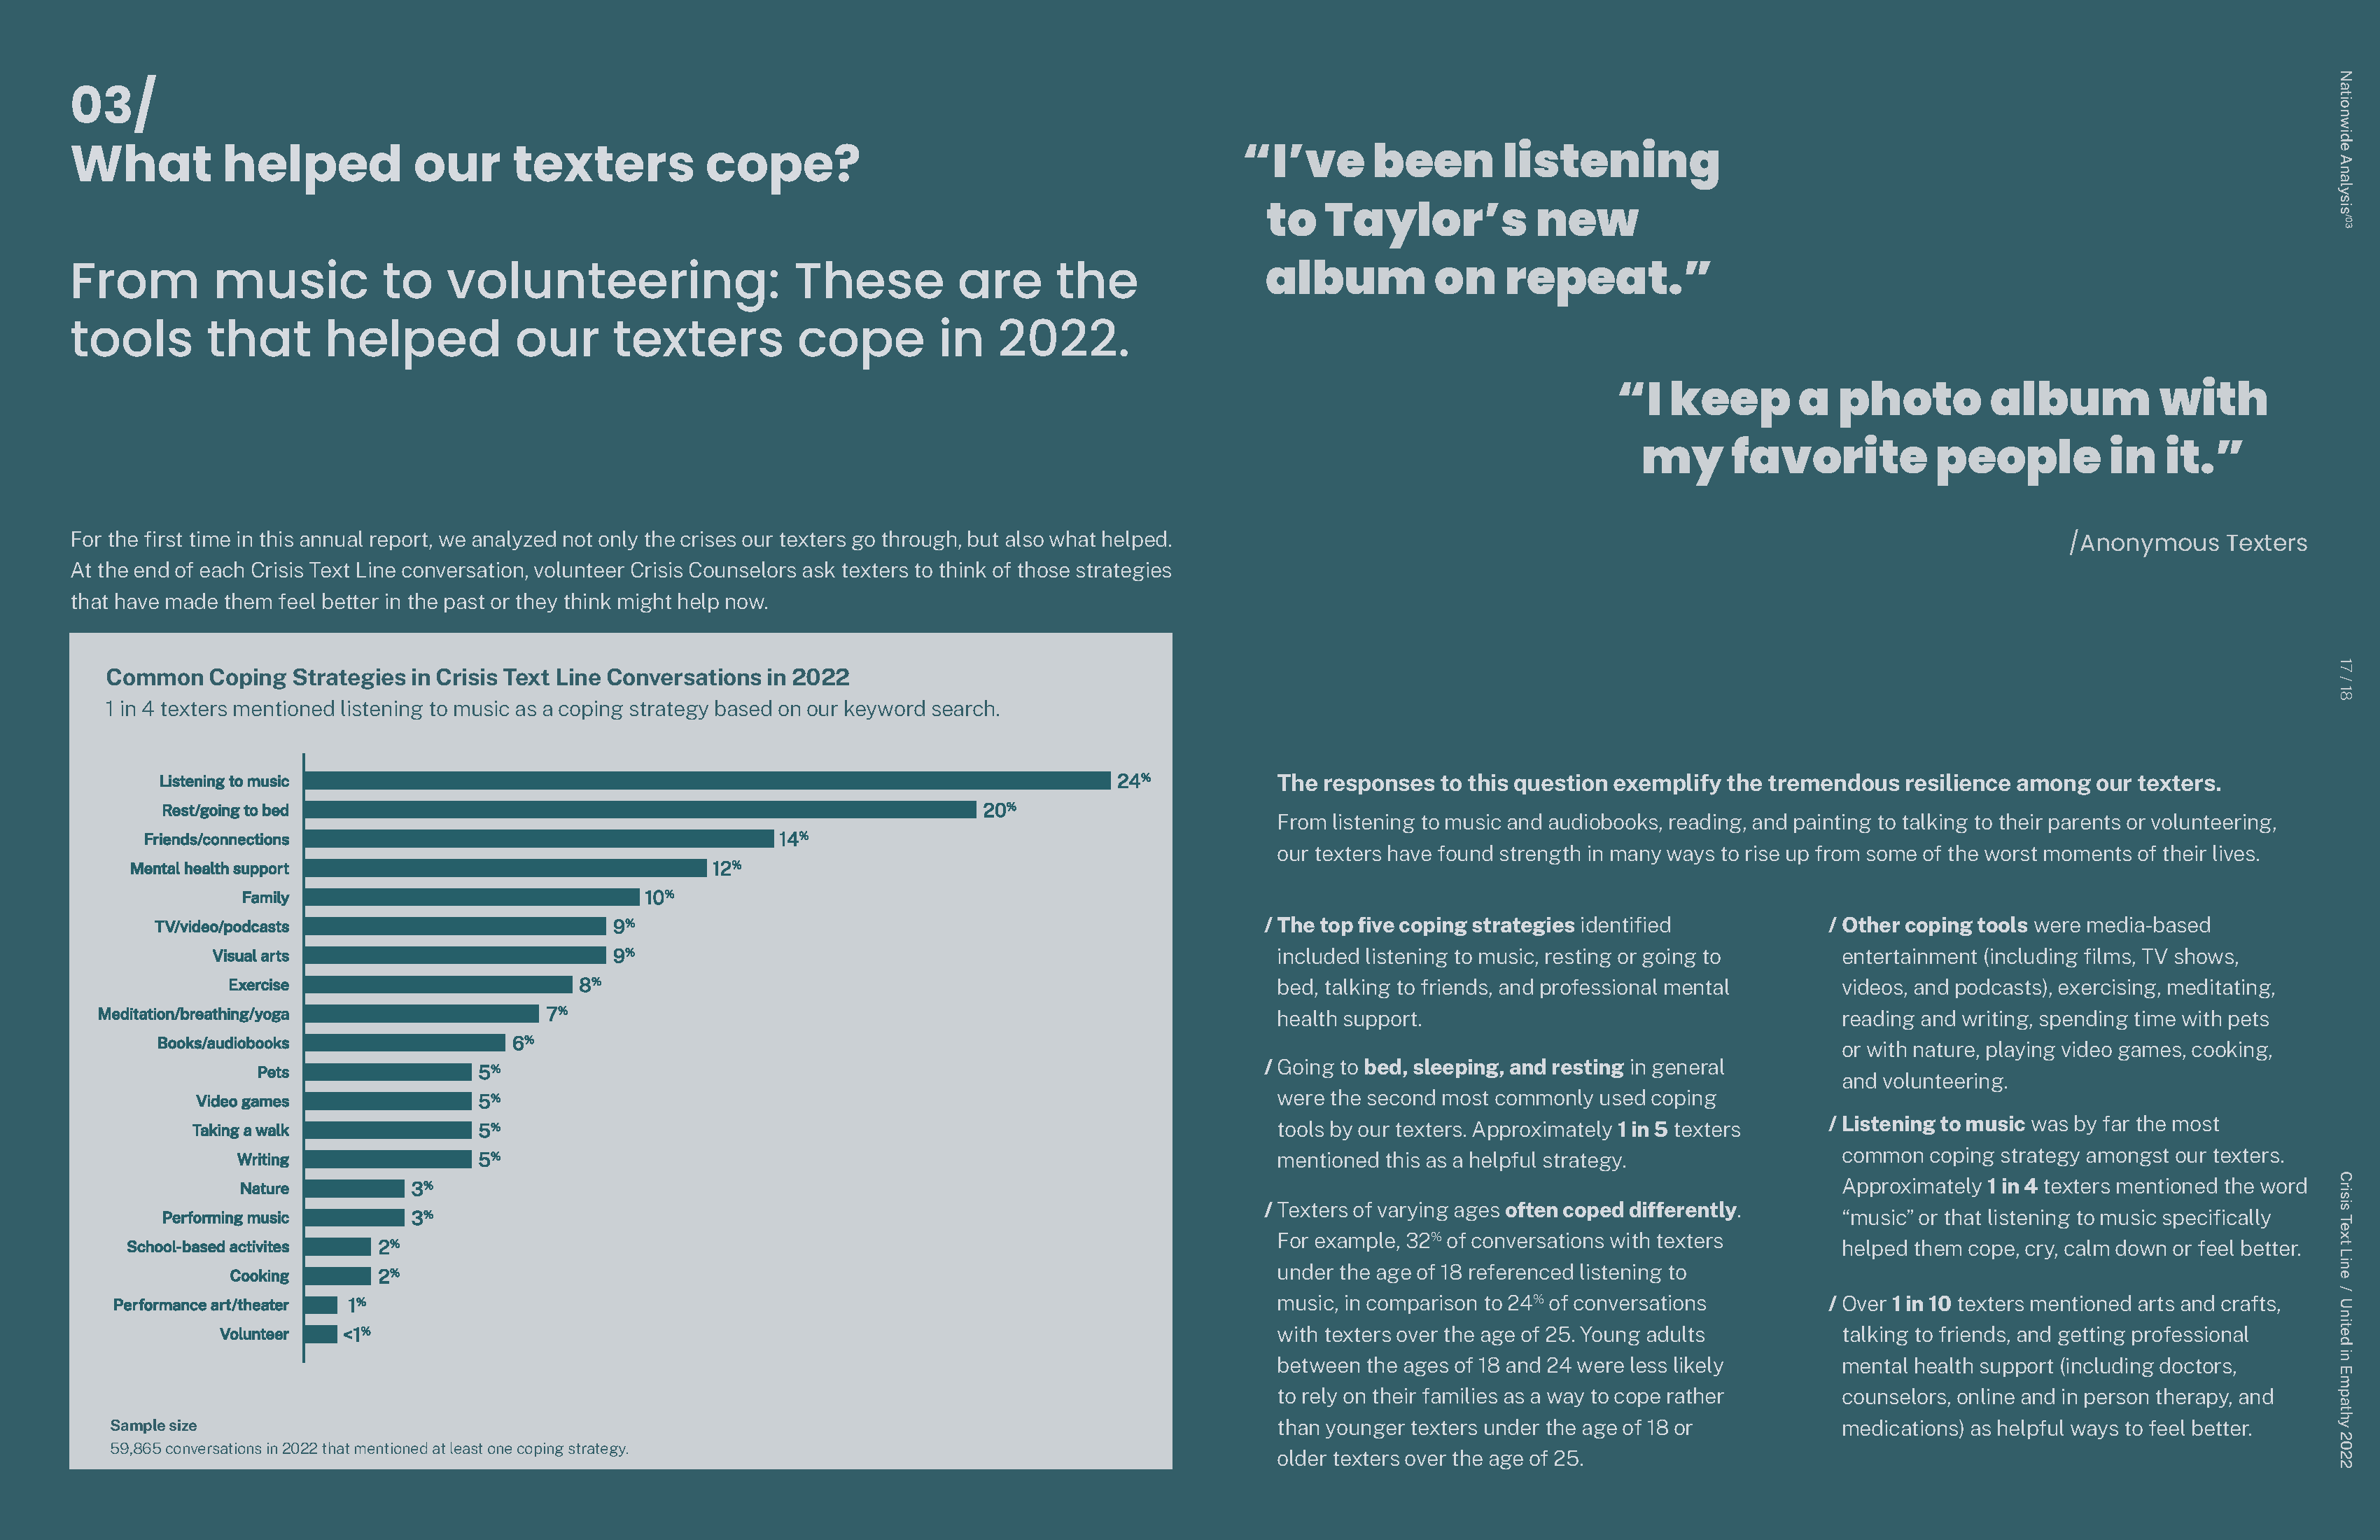
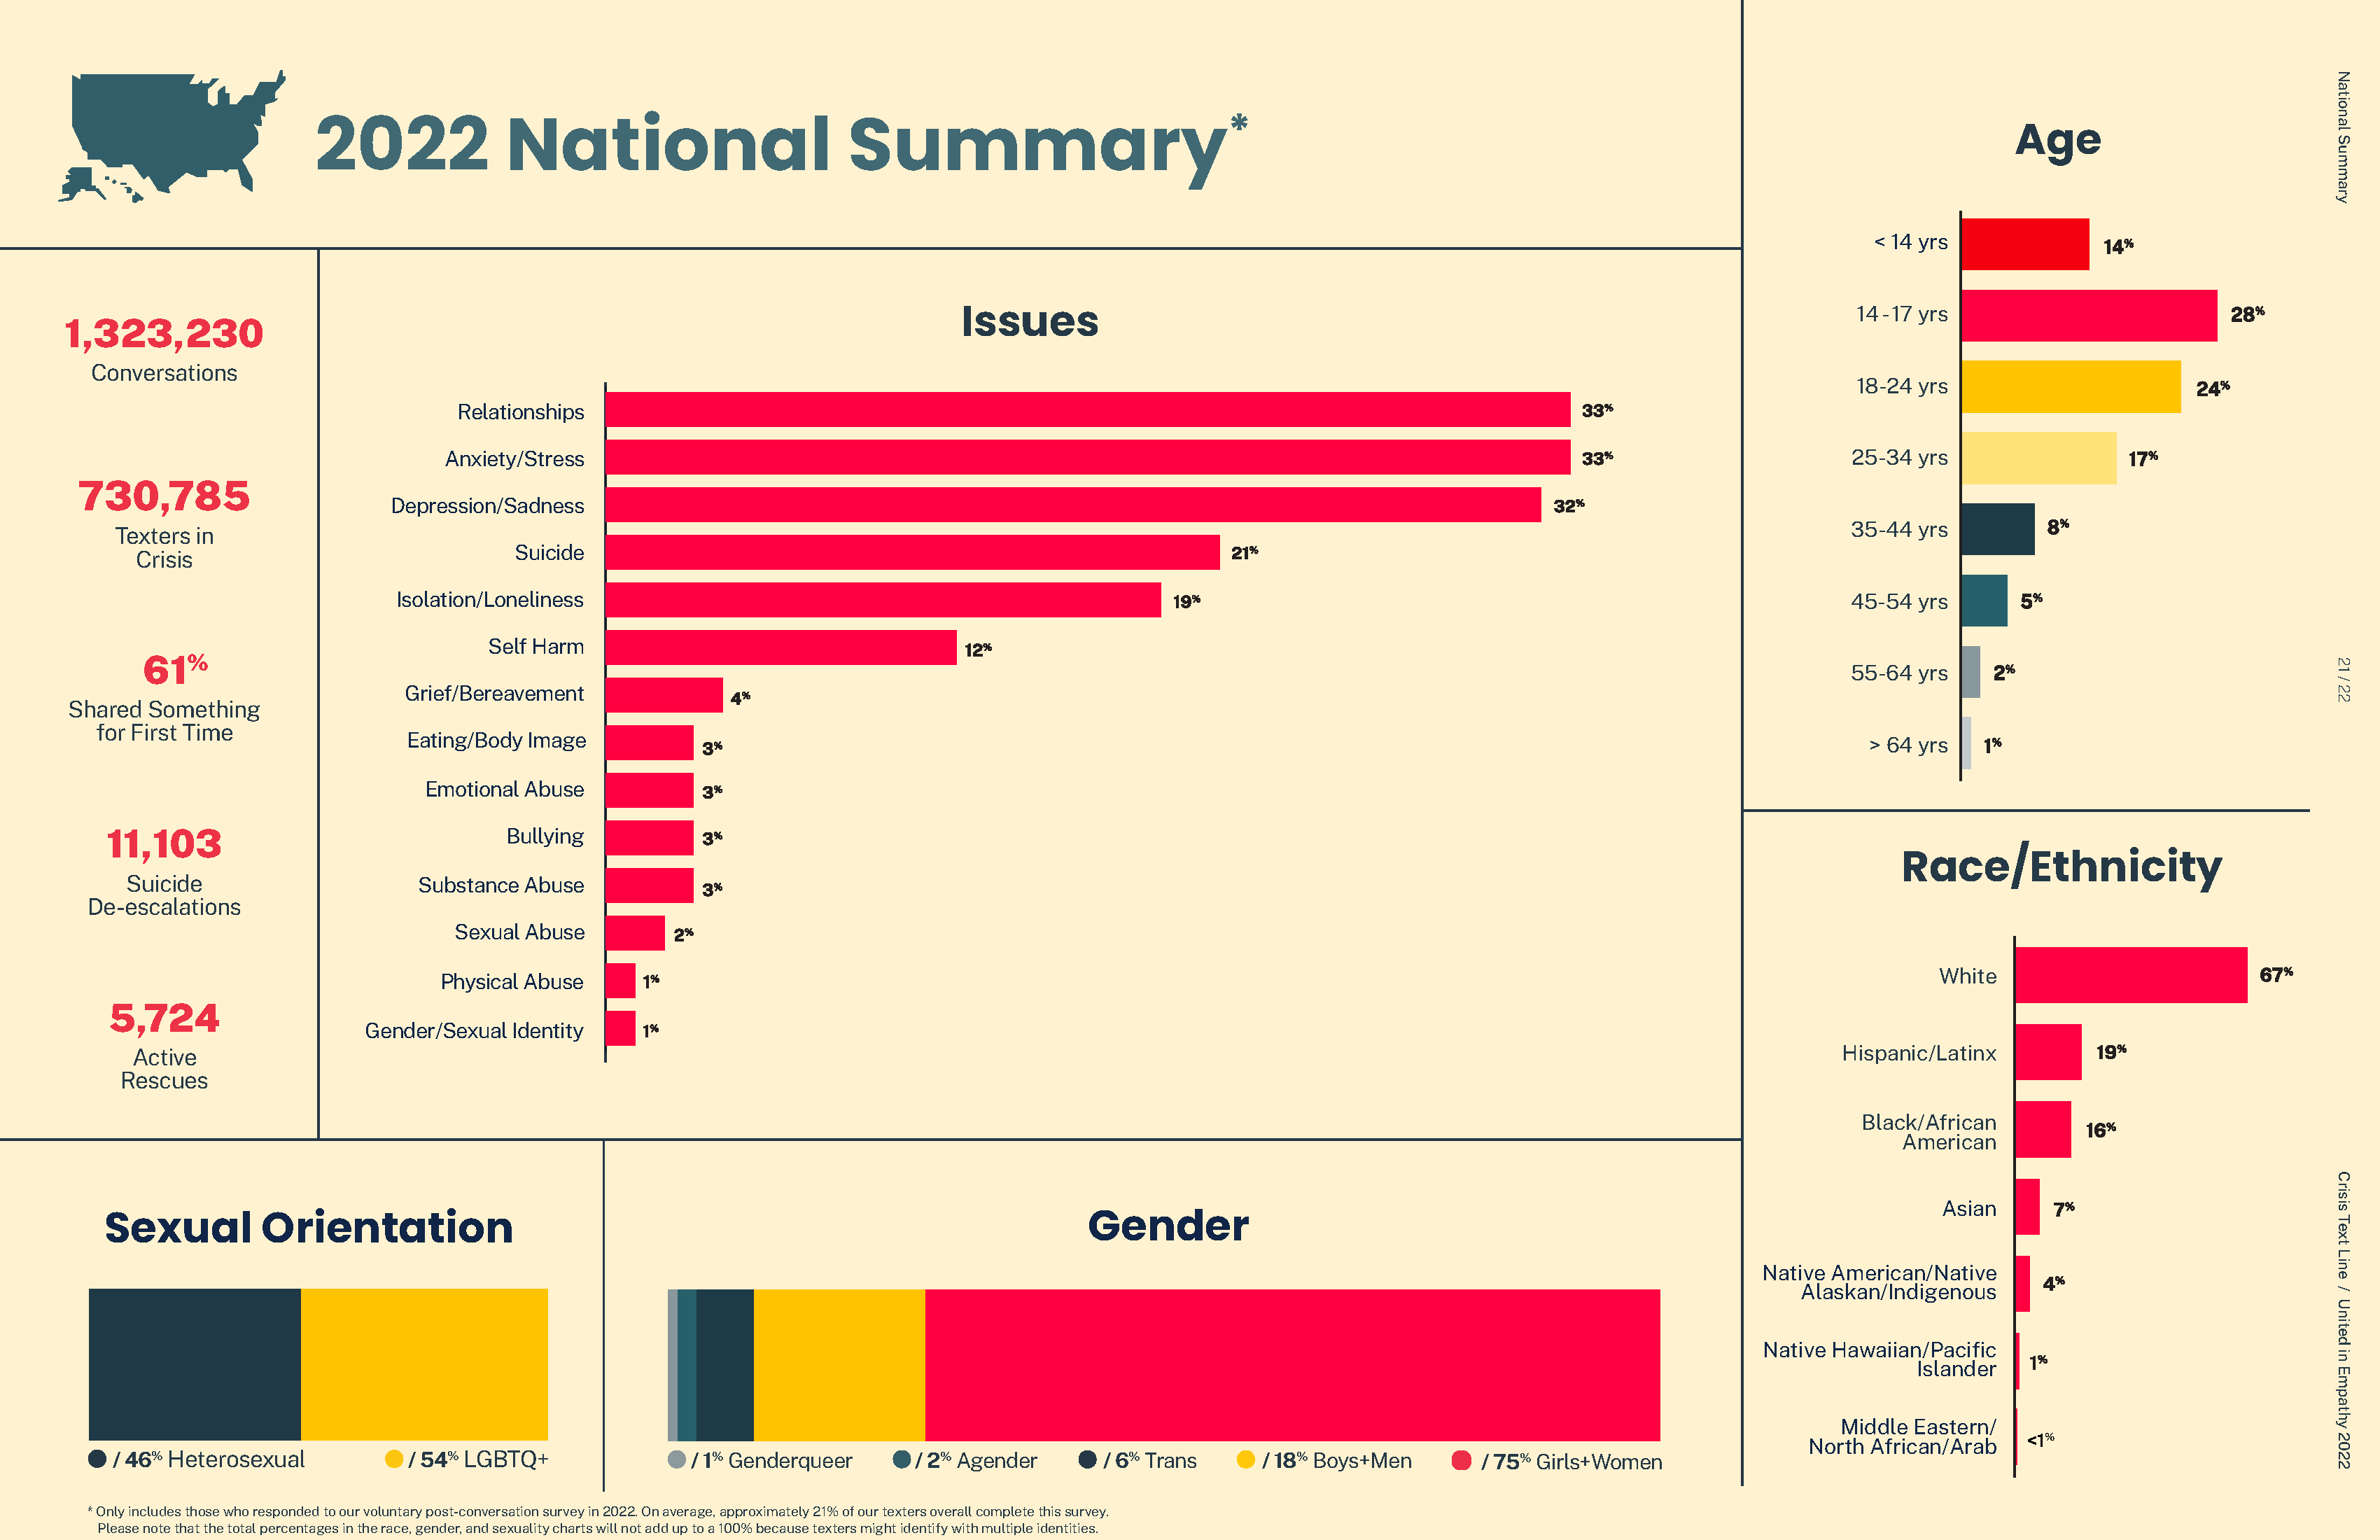
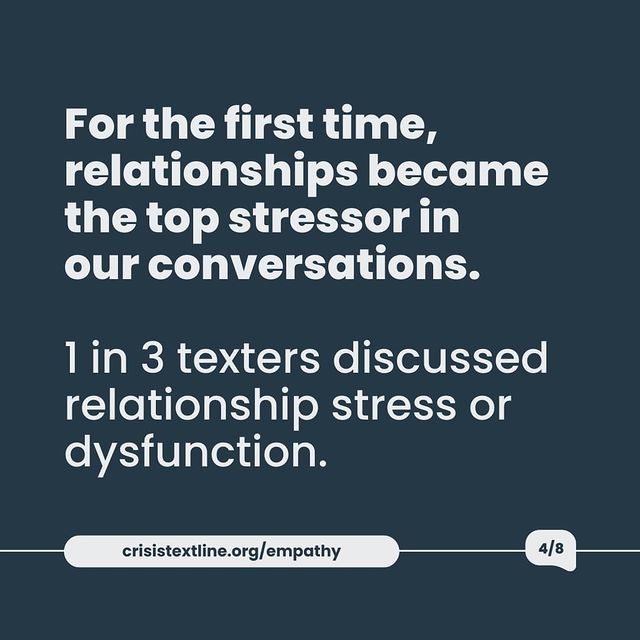
Presenting complex data in a digestible and compelling way was a top priority. We utilized a variety of data visualization tools, such as infographics, charts, and graphs, to transform raw data into meaningful insights. Each visual element was designed to highlight key statistics, such as the 16% increase in substance use conversations and the prominence of relationship stress as a top issue.
⸺ Consistency and Flow
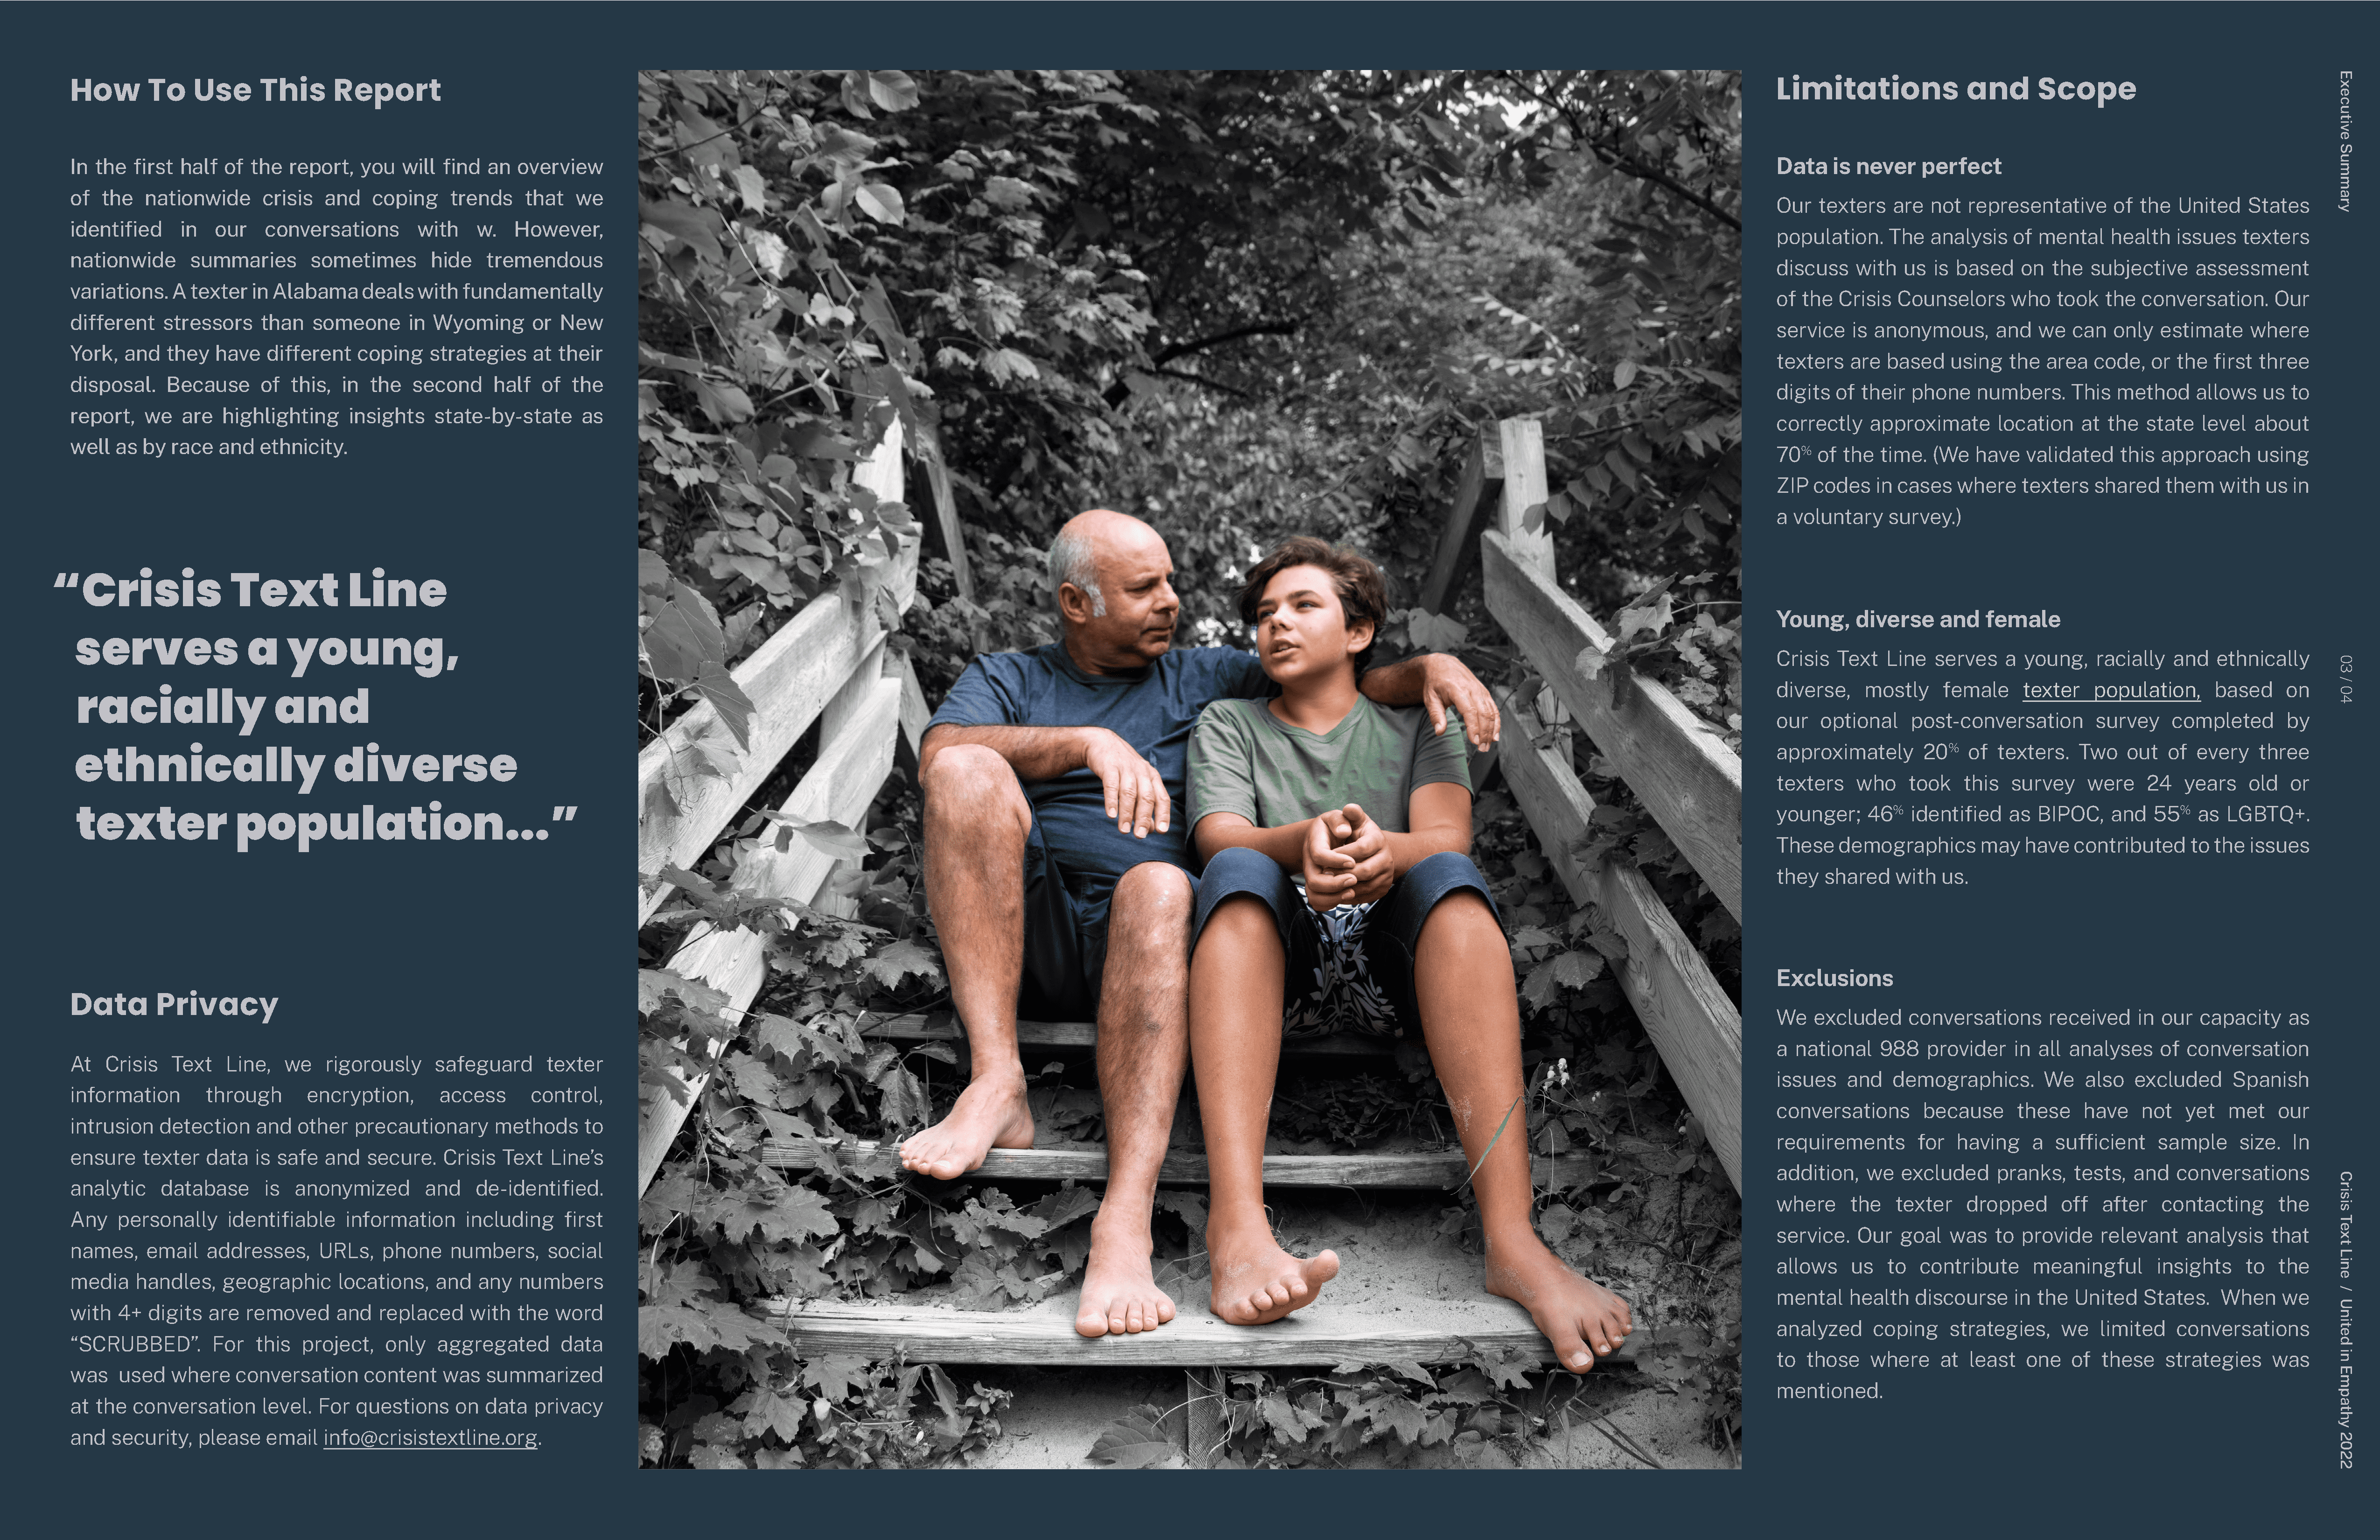
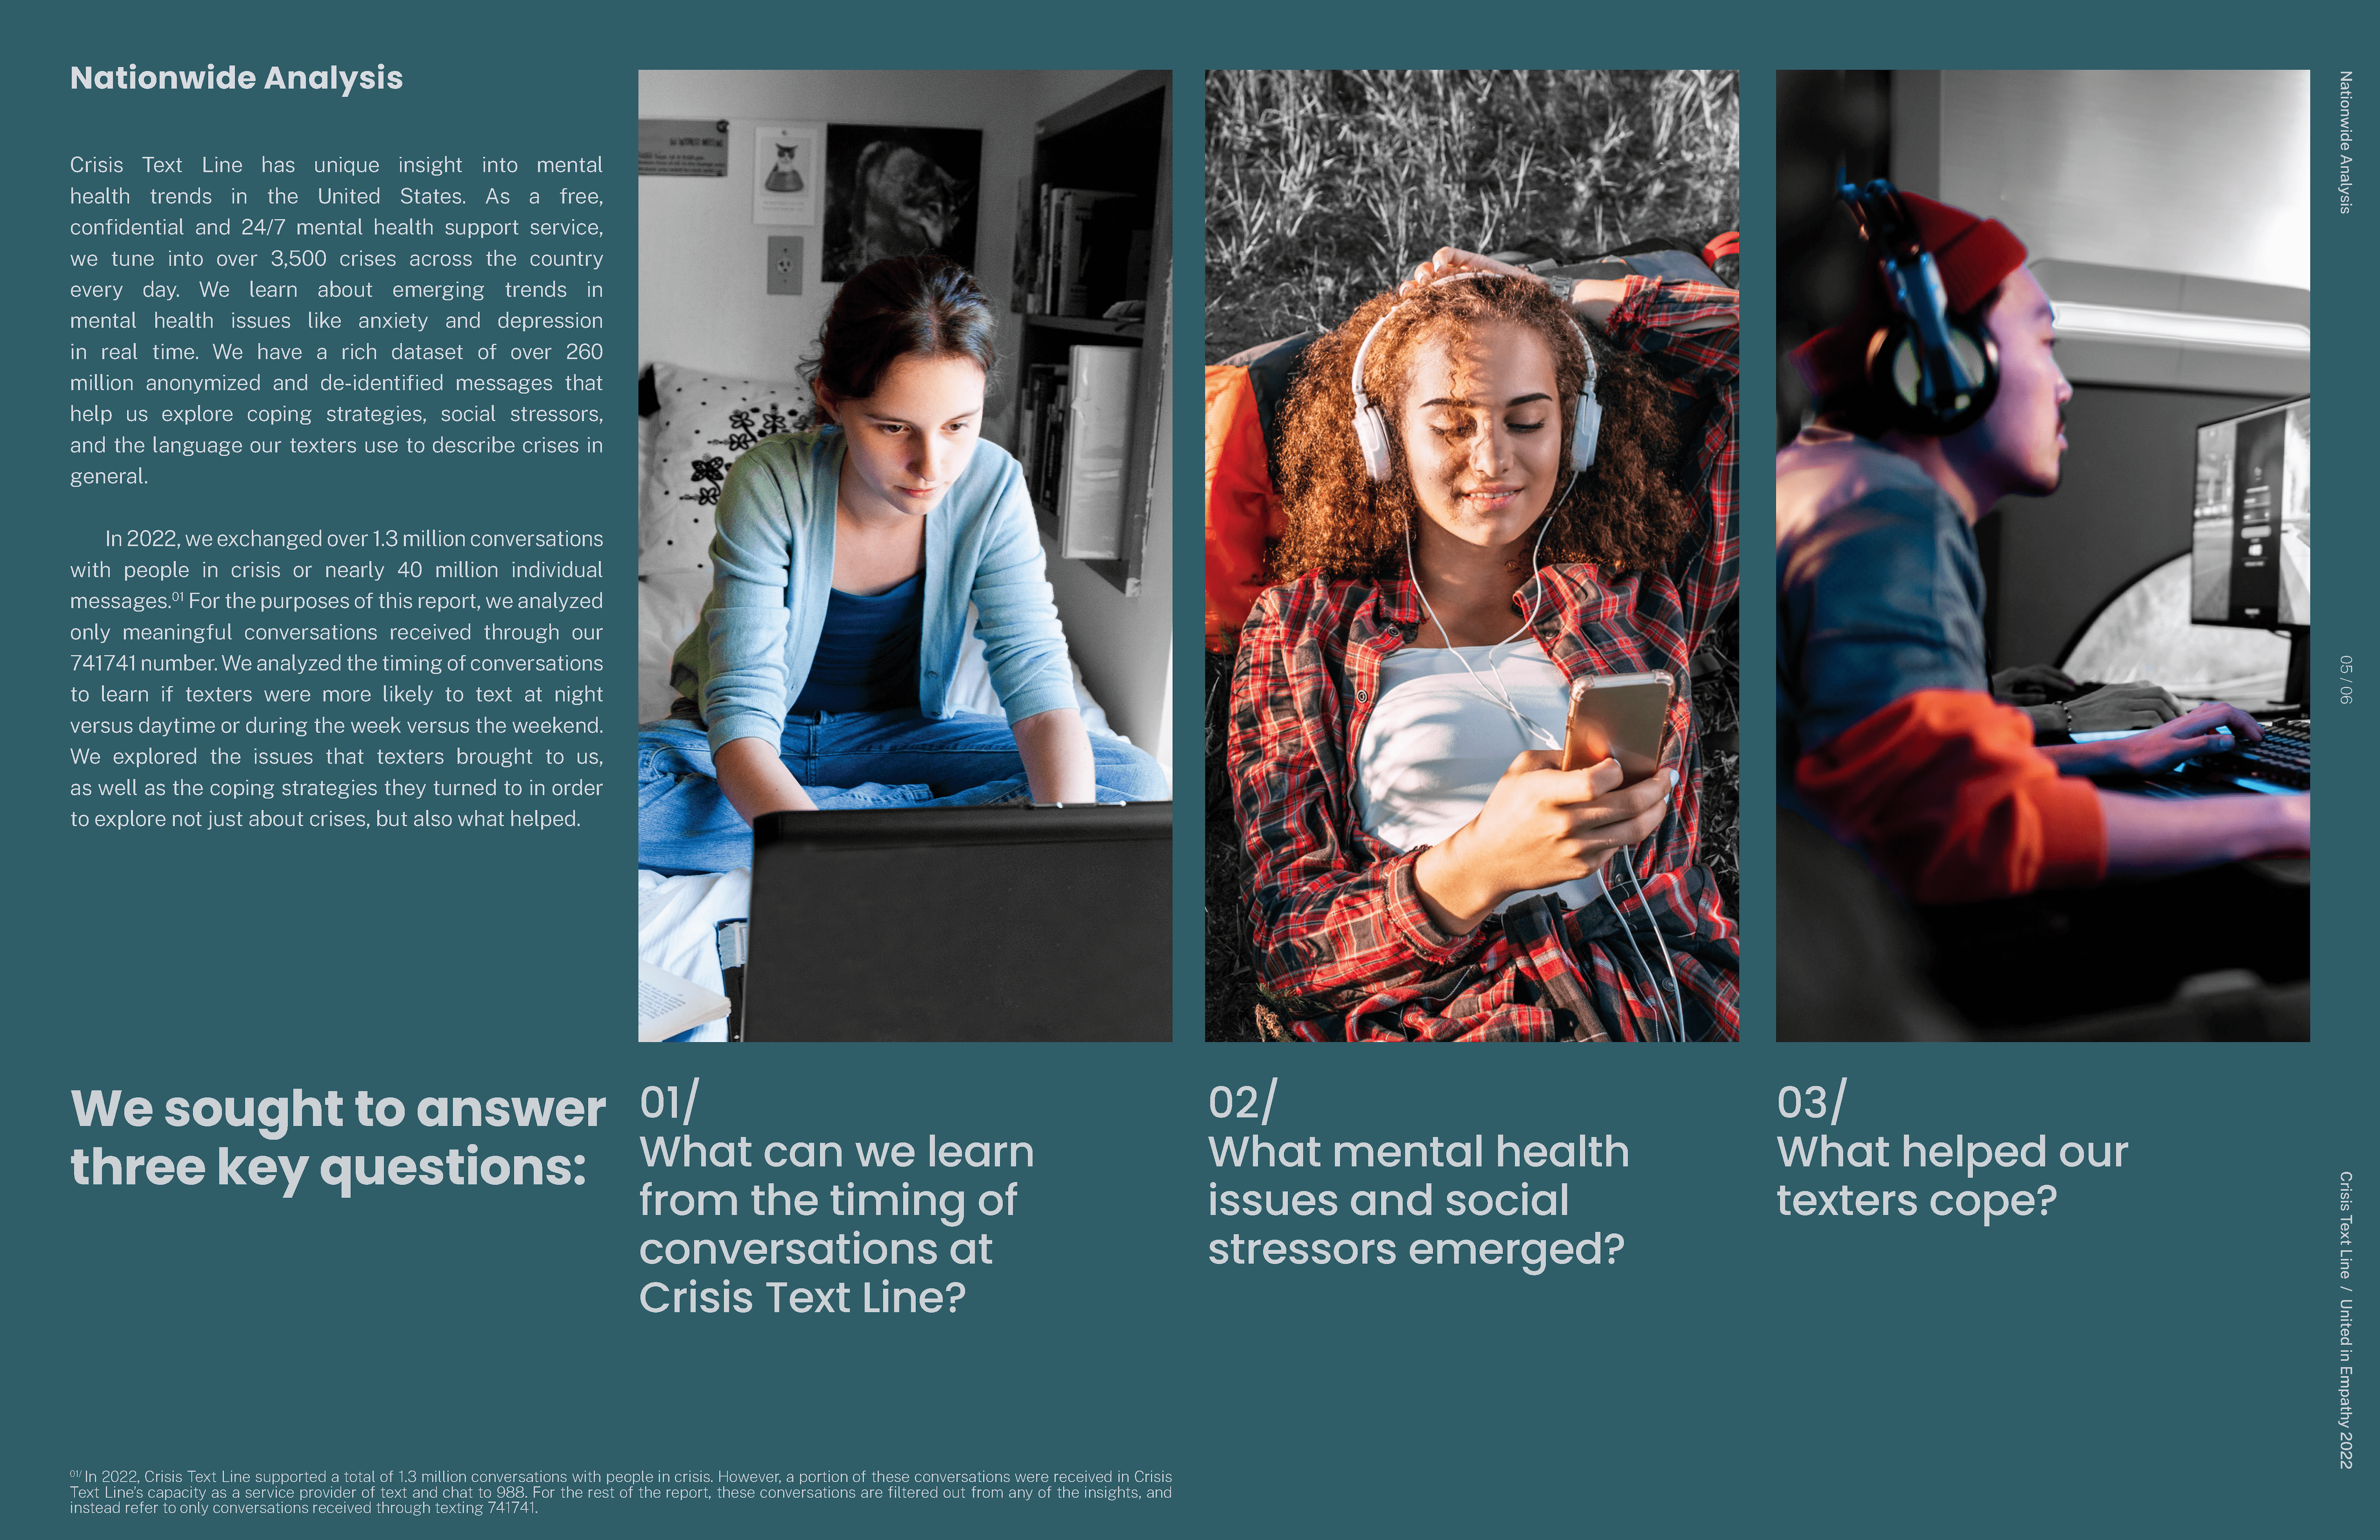
Ensuring a consistent and coherent flow throughout the report was crucial. Each section was meticulously designed to transition smoothly to the next, creating a cohesive narrative that guides the reader through the findings. Headings, subheadings, and thematic elements were strategically used to maintain structure and clarity.
⸺ Human Connection
To humanize the data, we incorporated real quotes from individuals who reached out for help. These testimonials provided a powerful, personal perspective on the statistics, reinforcing the real-world impact of the issues discussed. Additionally, the inclusion of volunteer Crisis Counselor stories added a layer of authenticity and dedication to the report.
Key Creative Elements
⸺ Color Palette
A calming and empathetic color scheme was chosen to create a safe and supportive visual environment for readers.
⸺ Typography
Clean and readable fonts were selected to enhance readability while maintaining a professional and approachable aesthetic.
⸺ Imagery
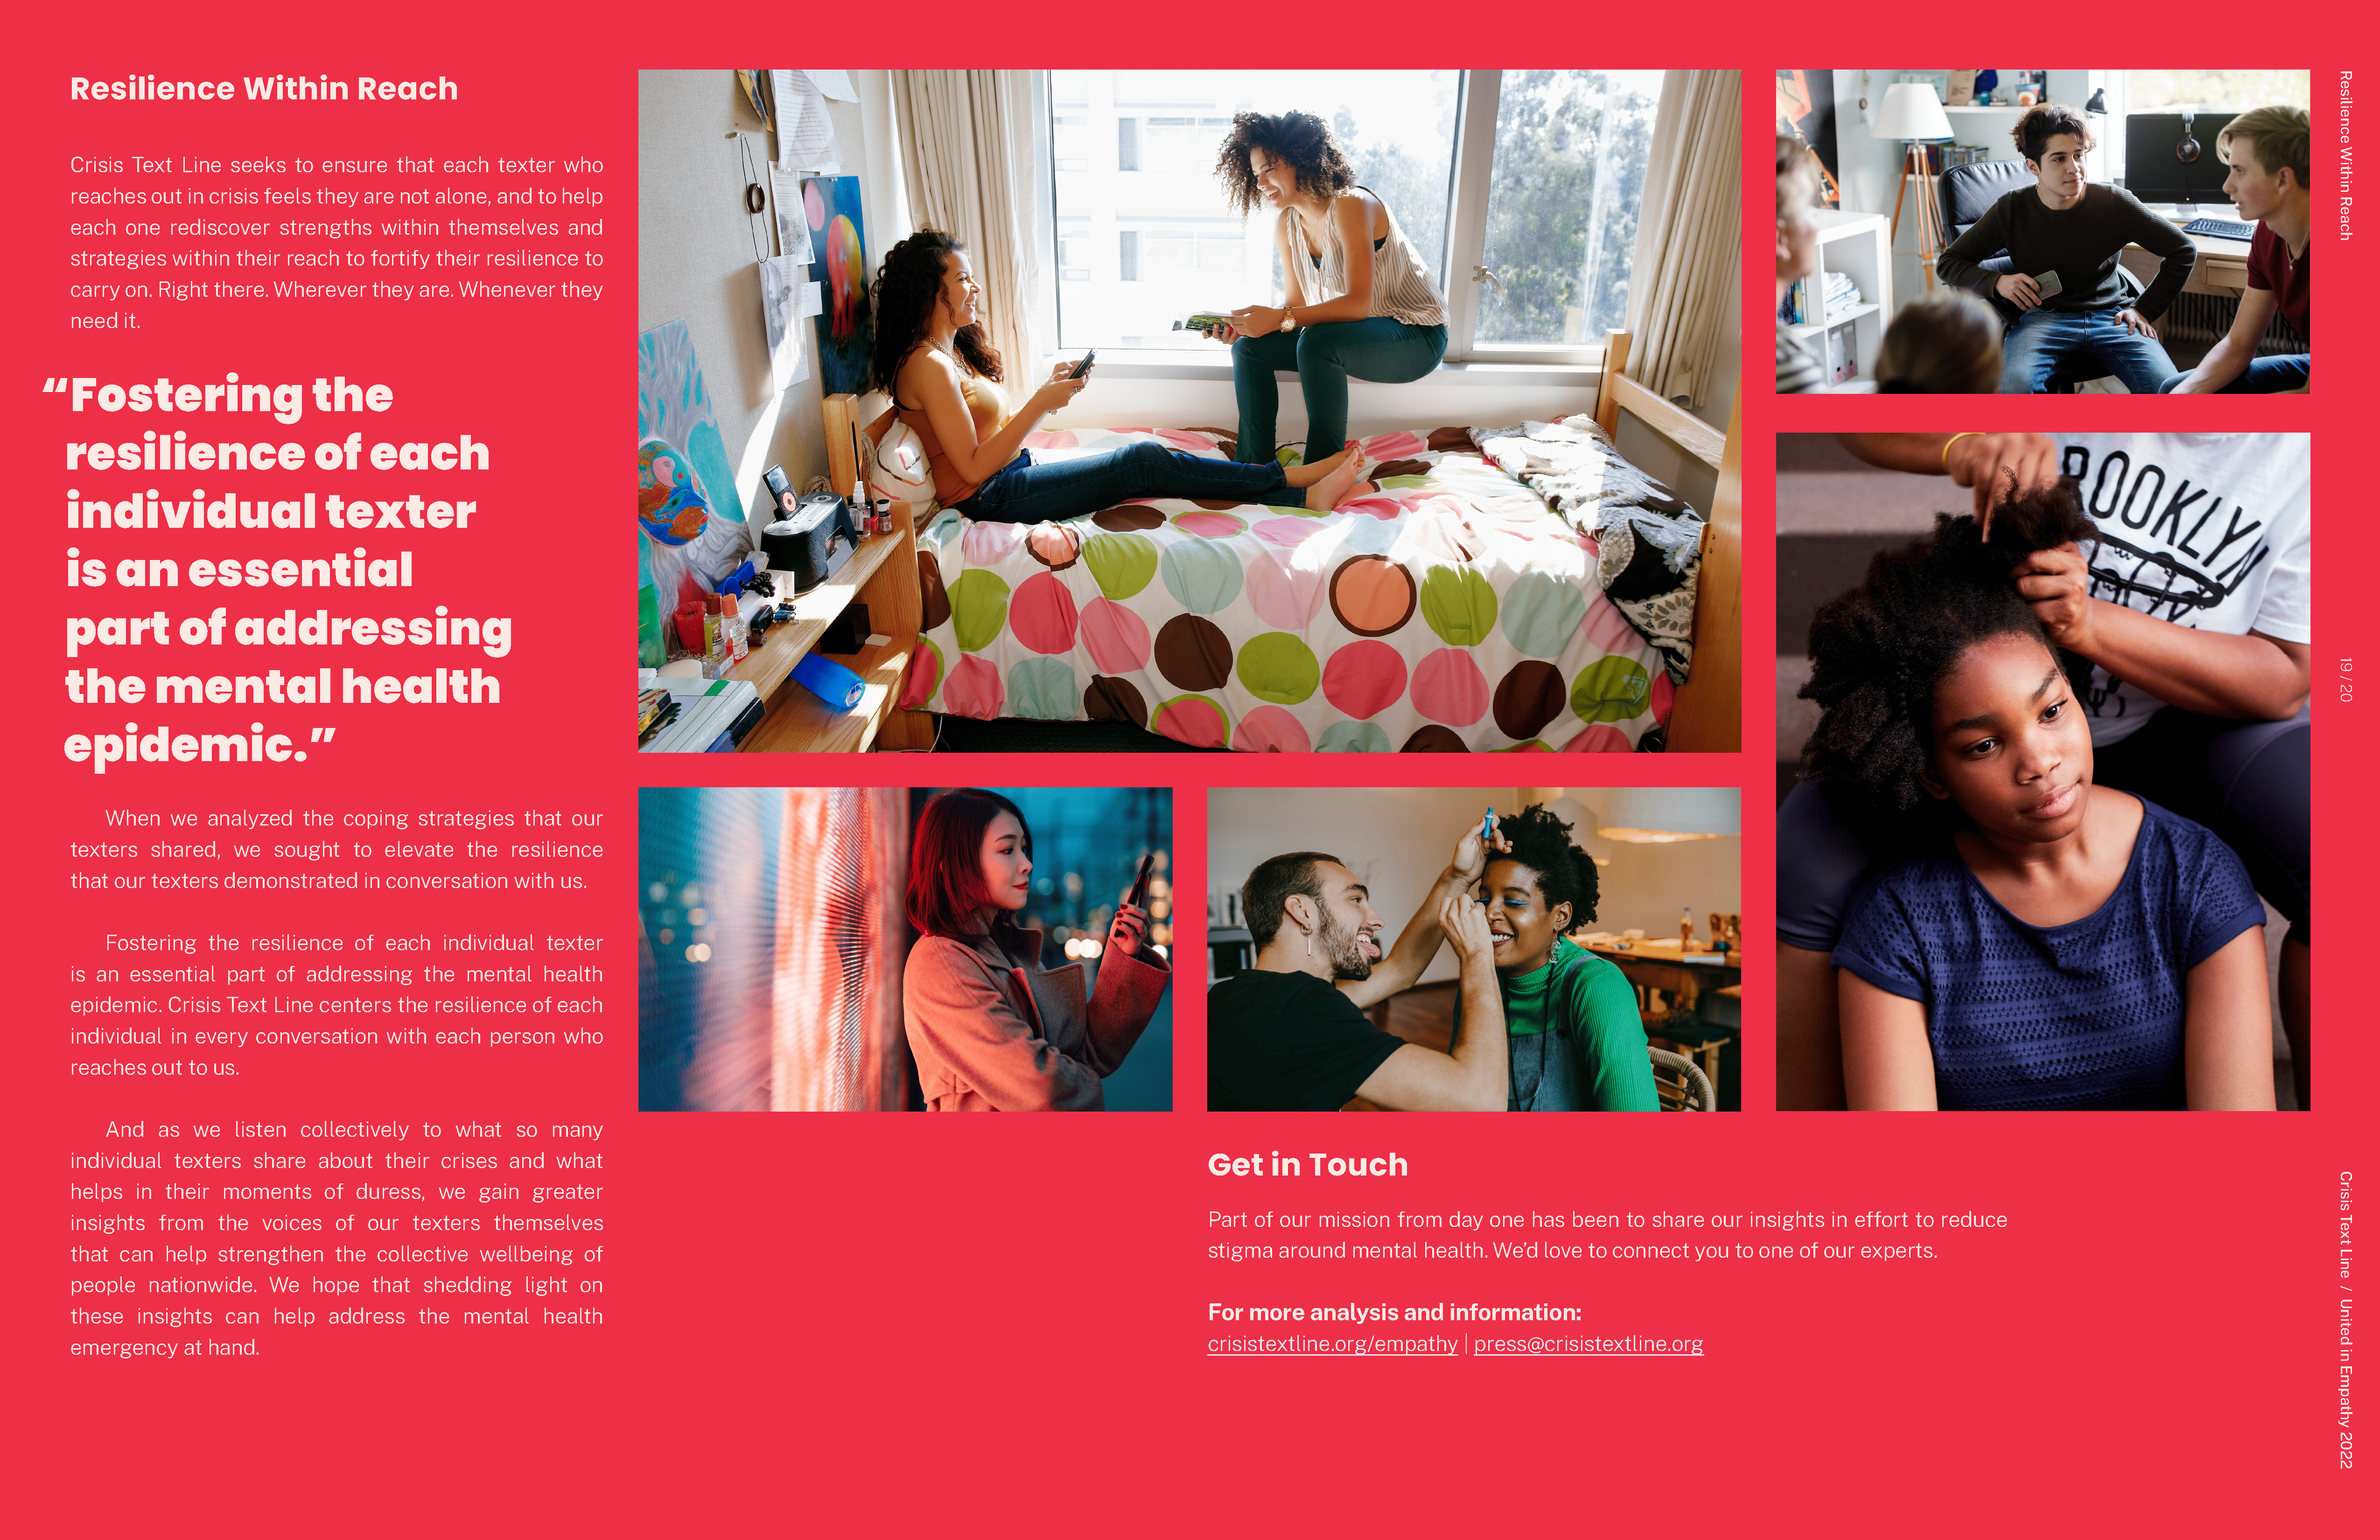
Thoughtfully chosen images that reflect the themes of connection, support, and resilience were integrated to reinforce the report's messages.
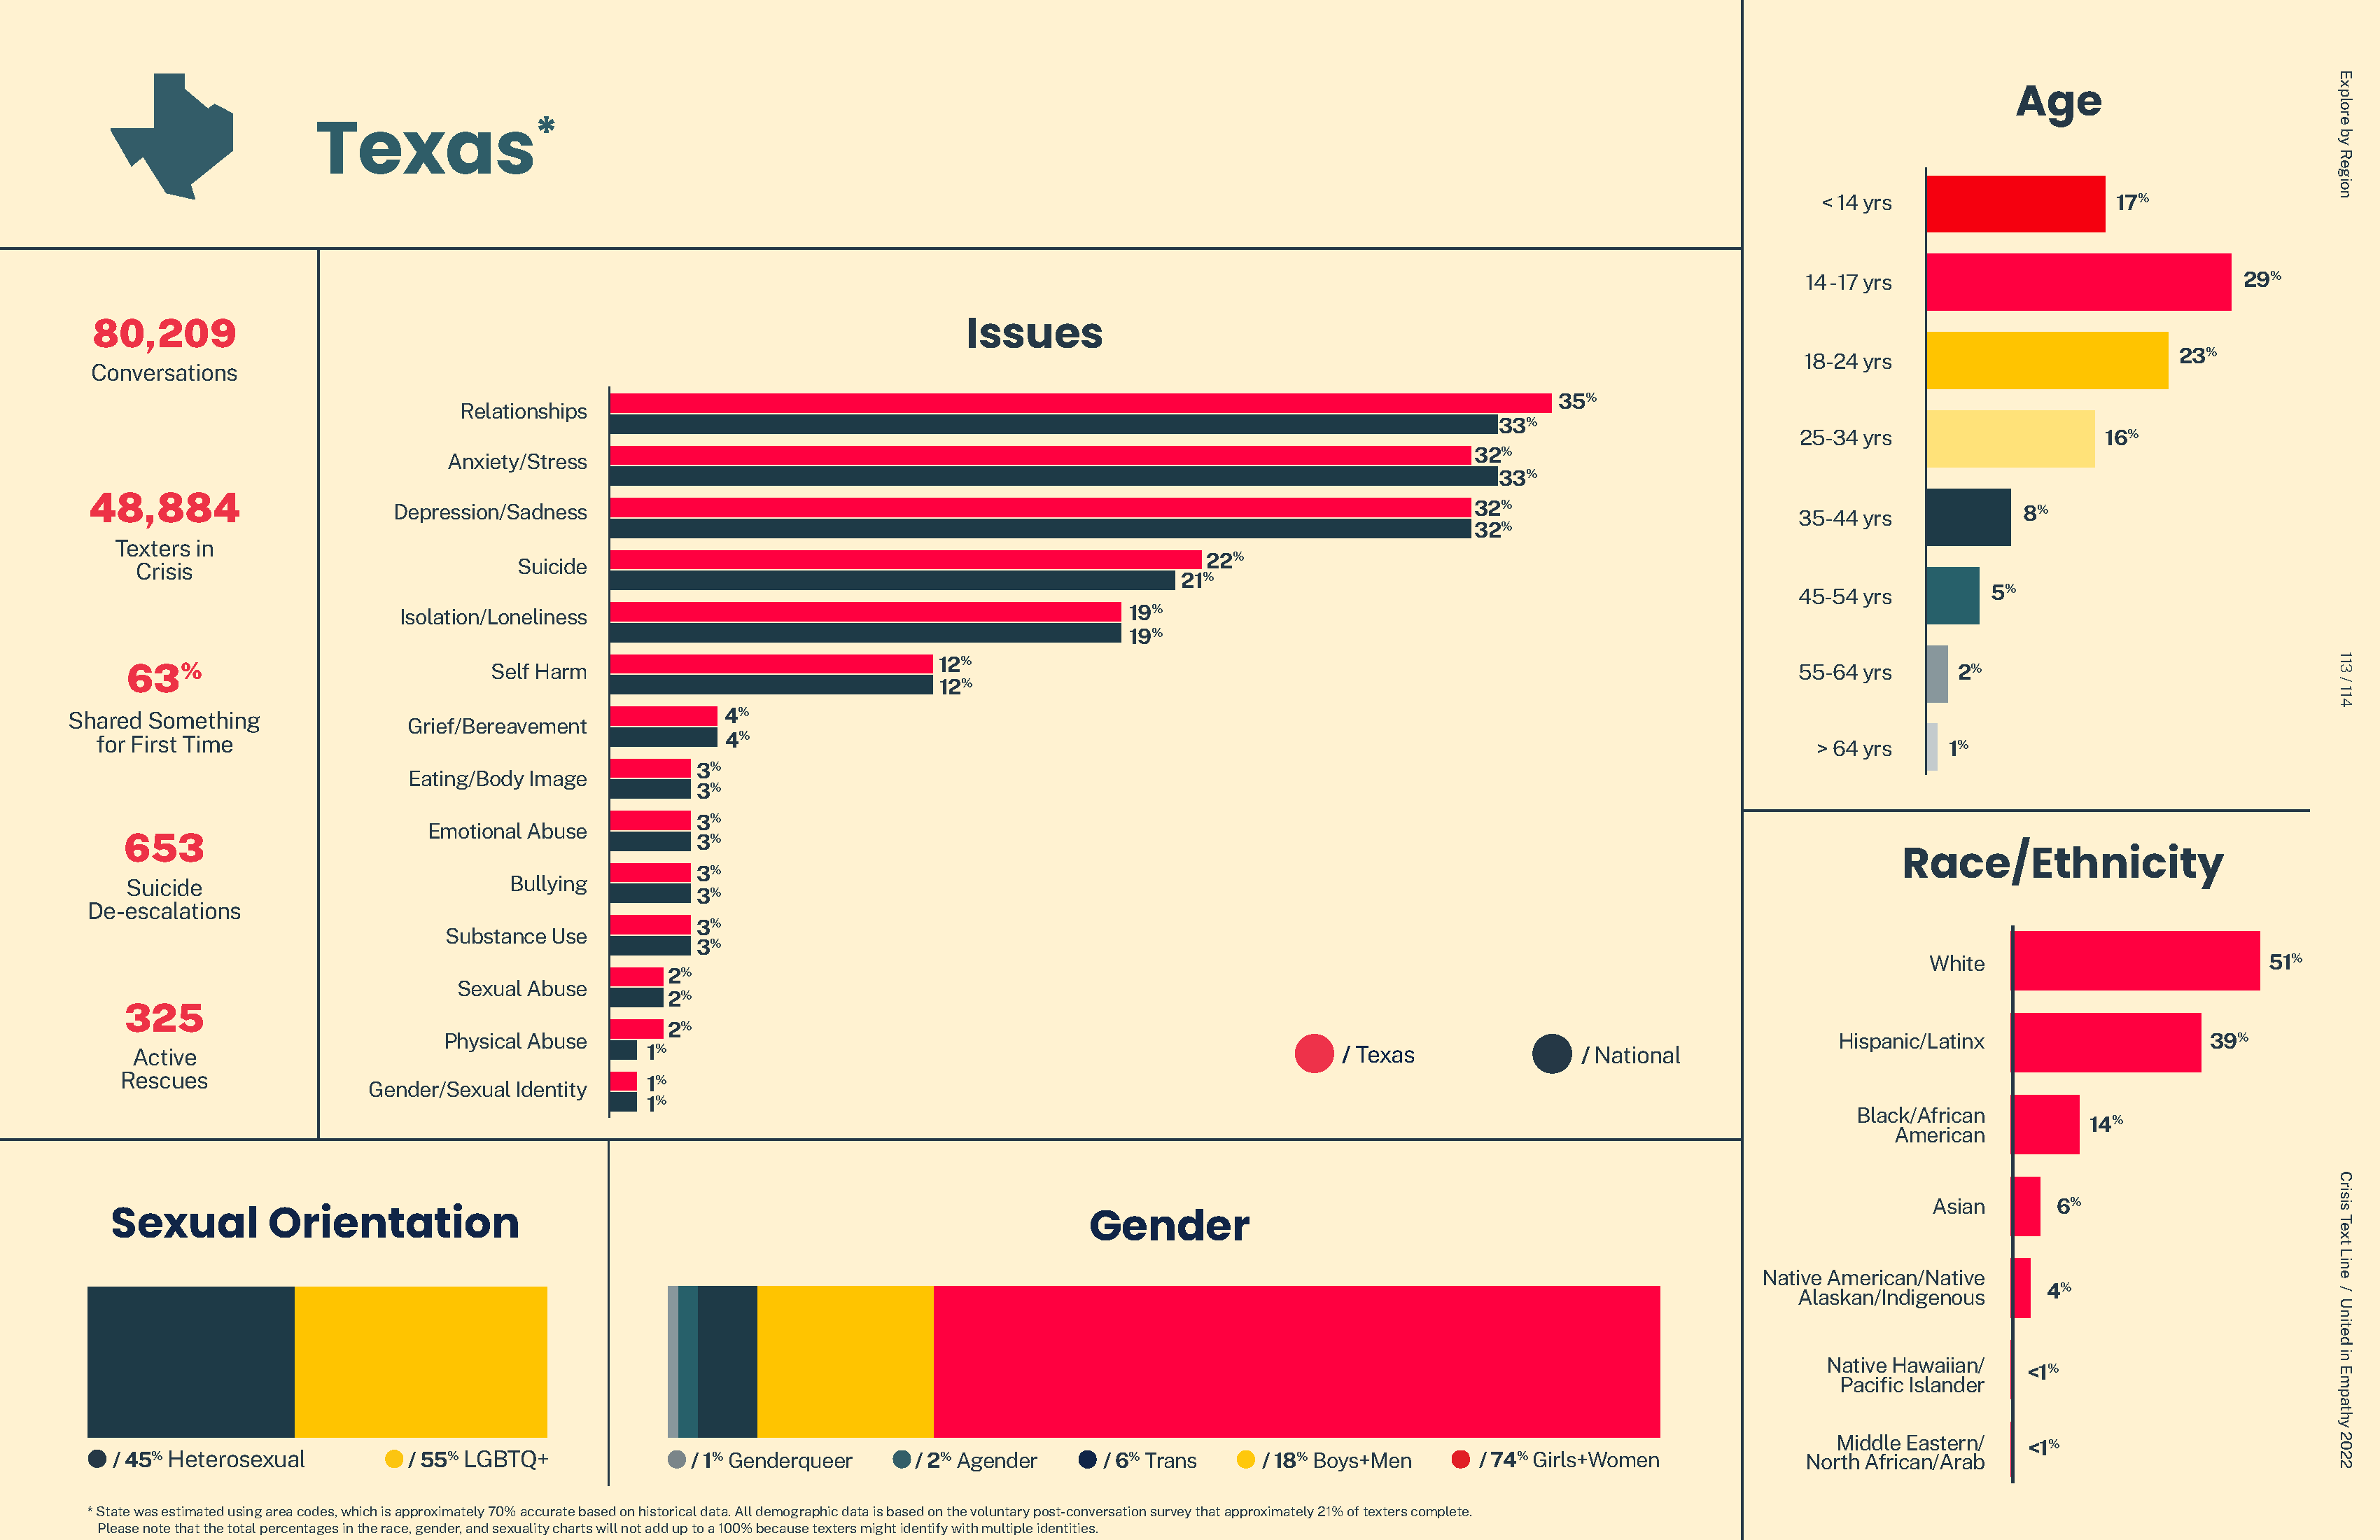
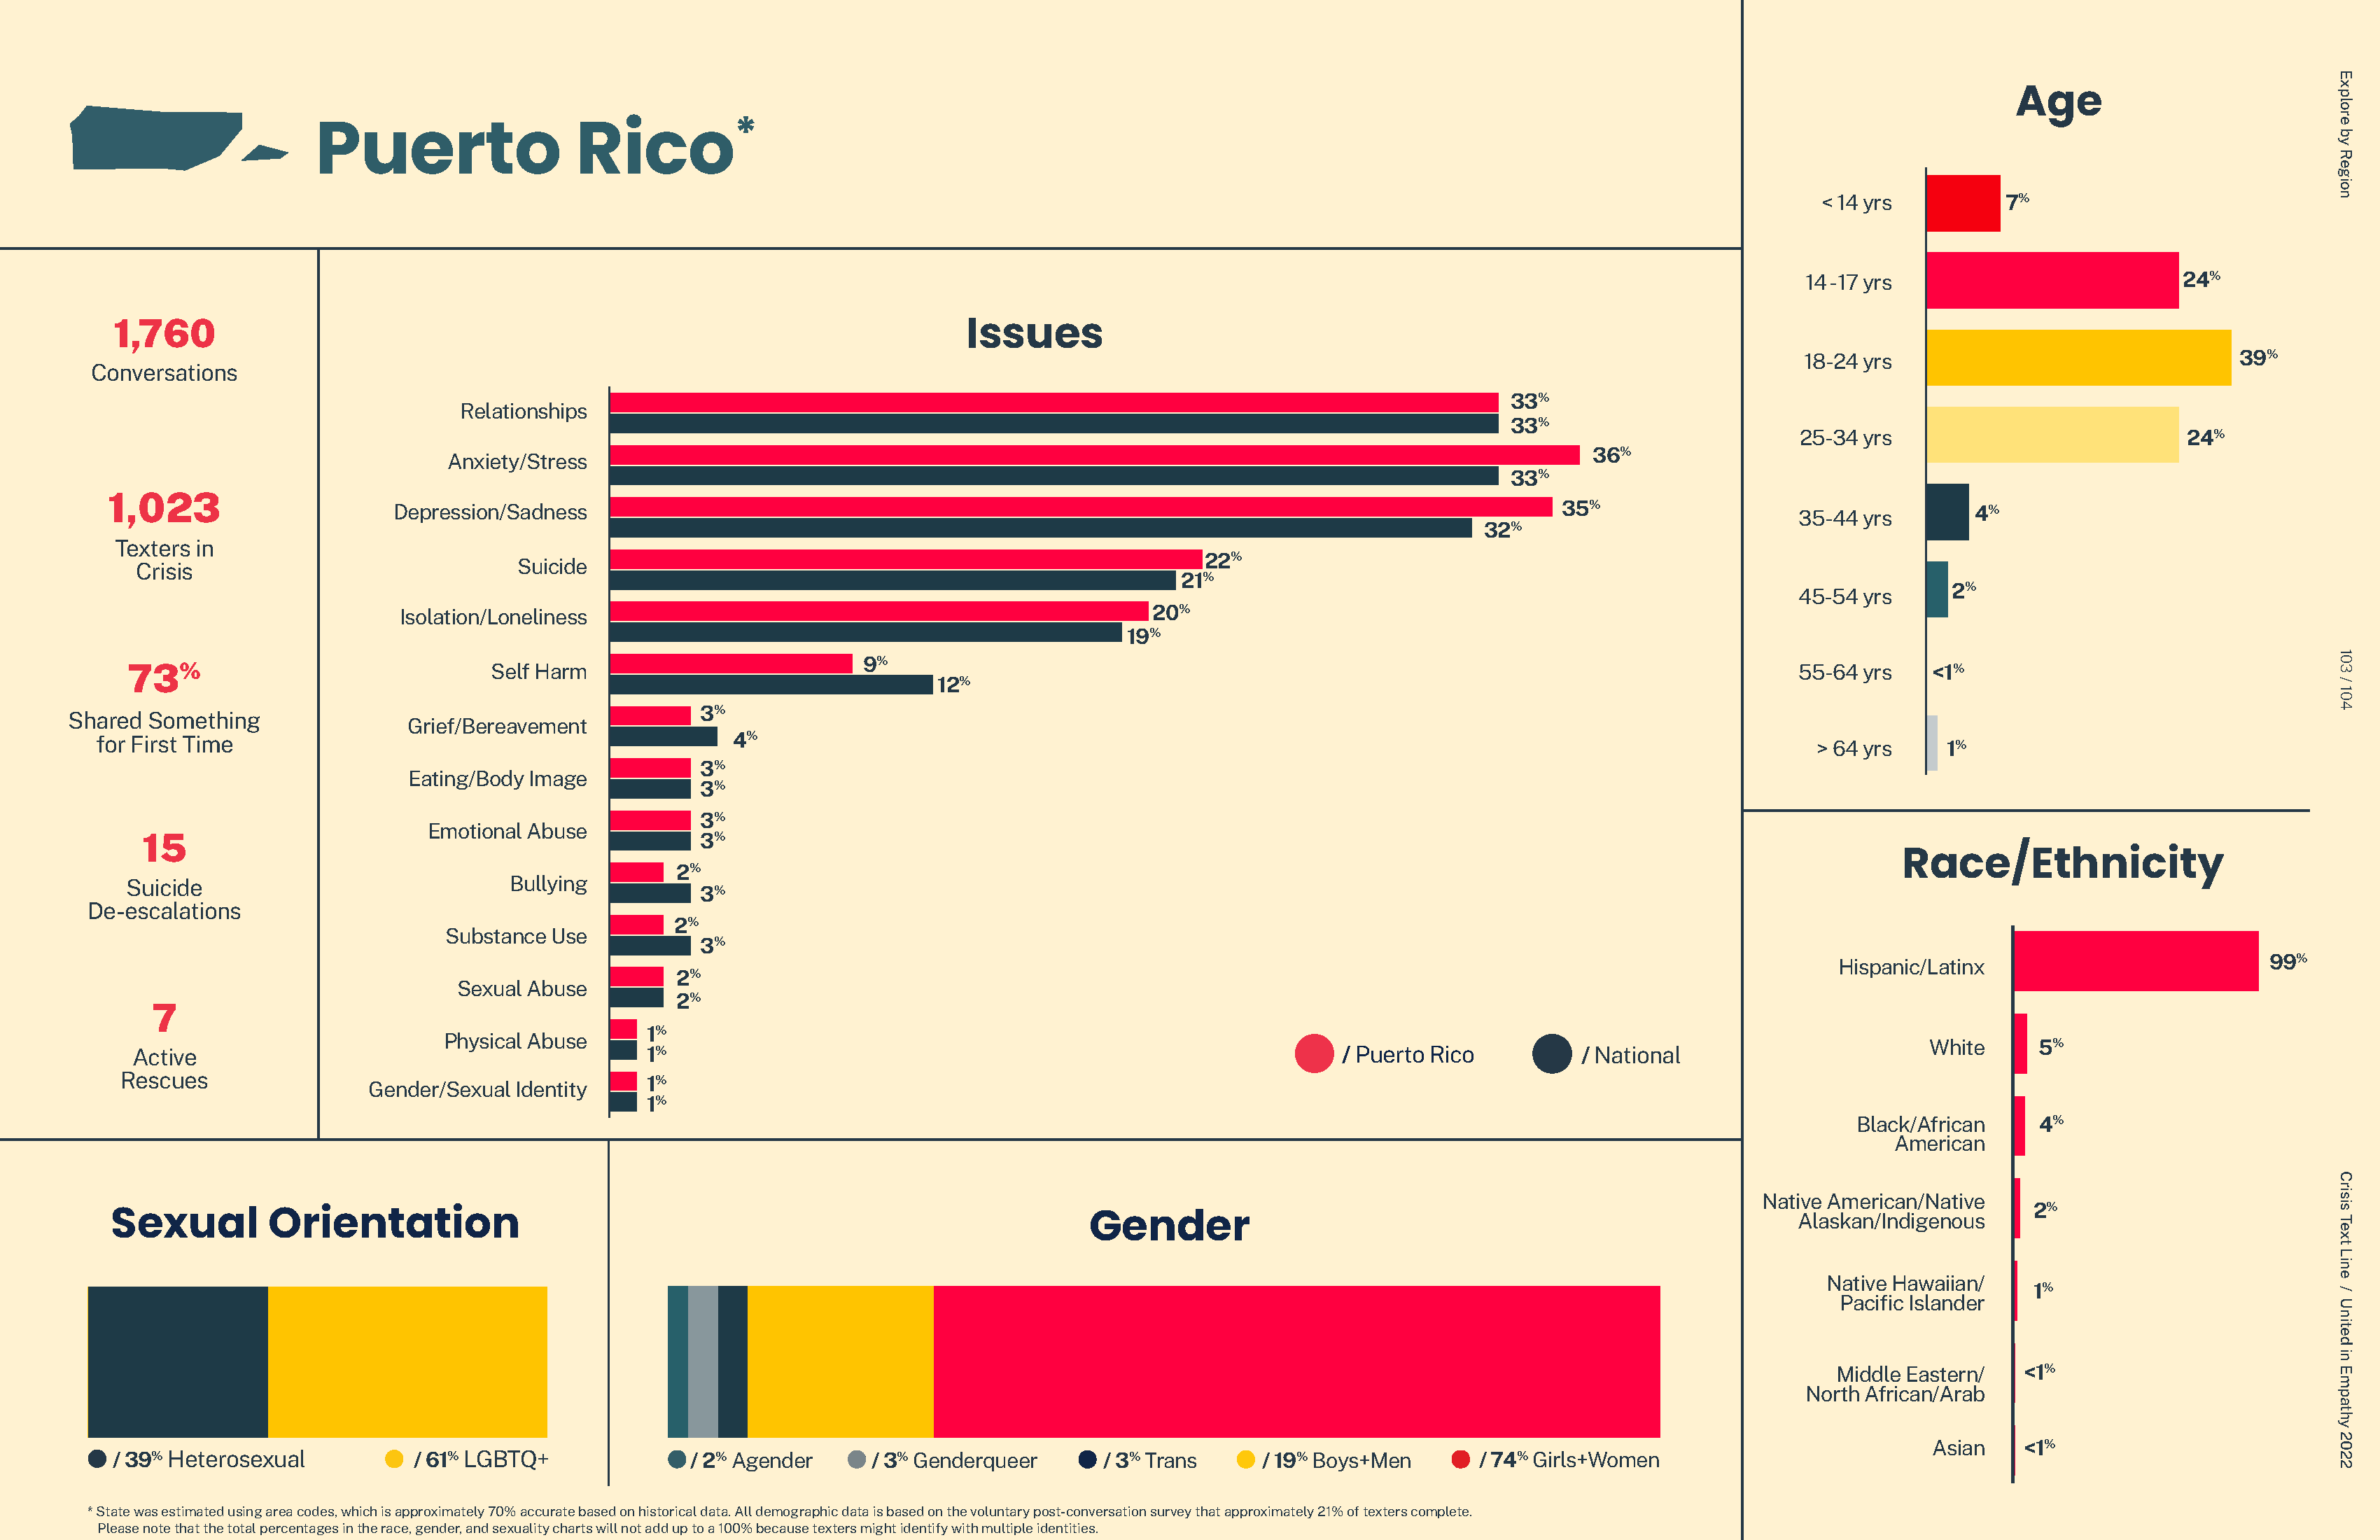
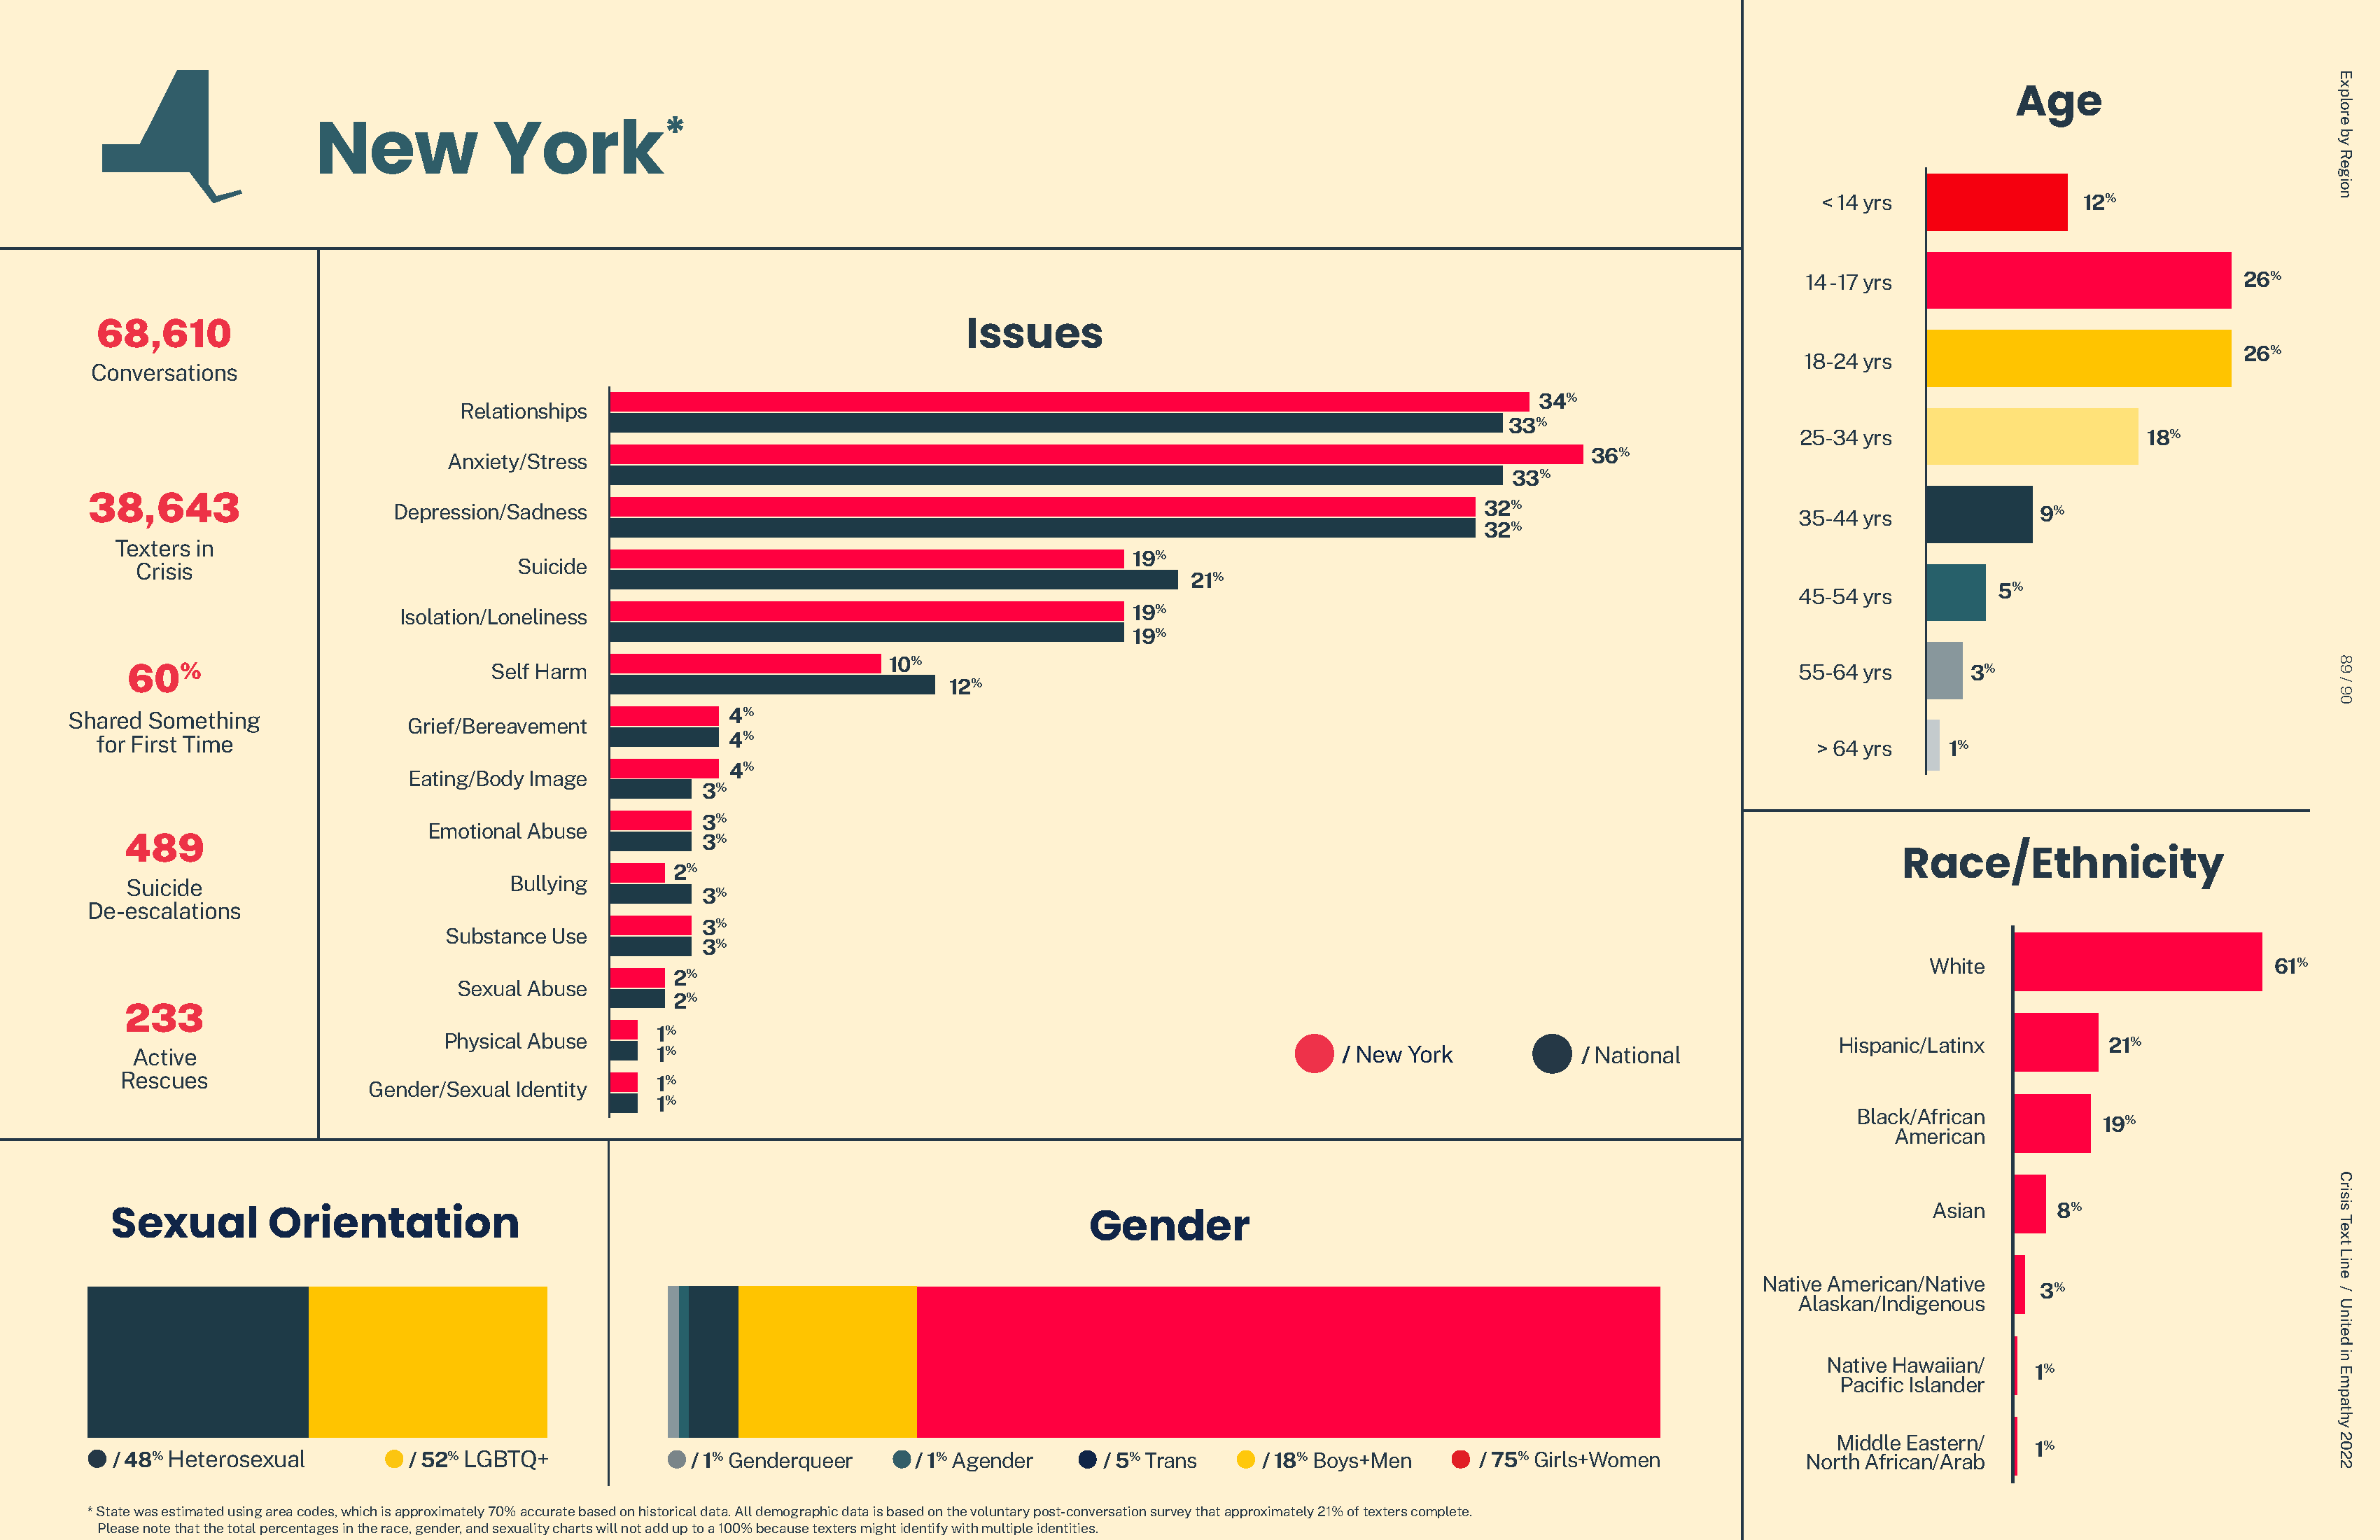
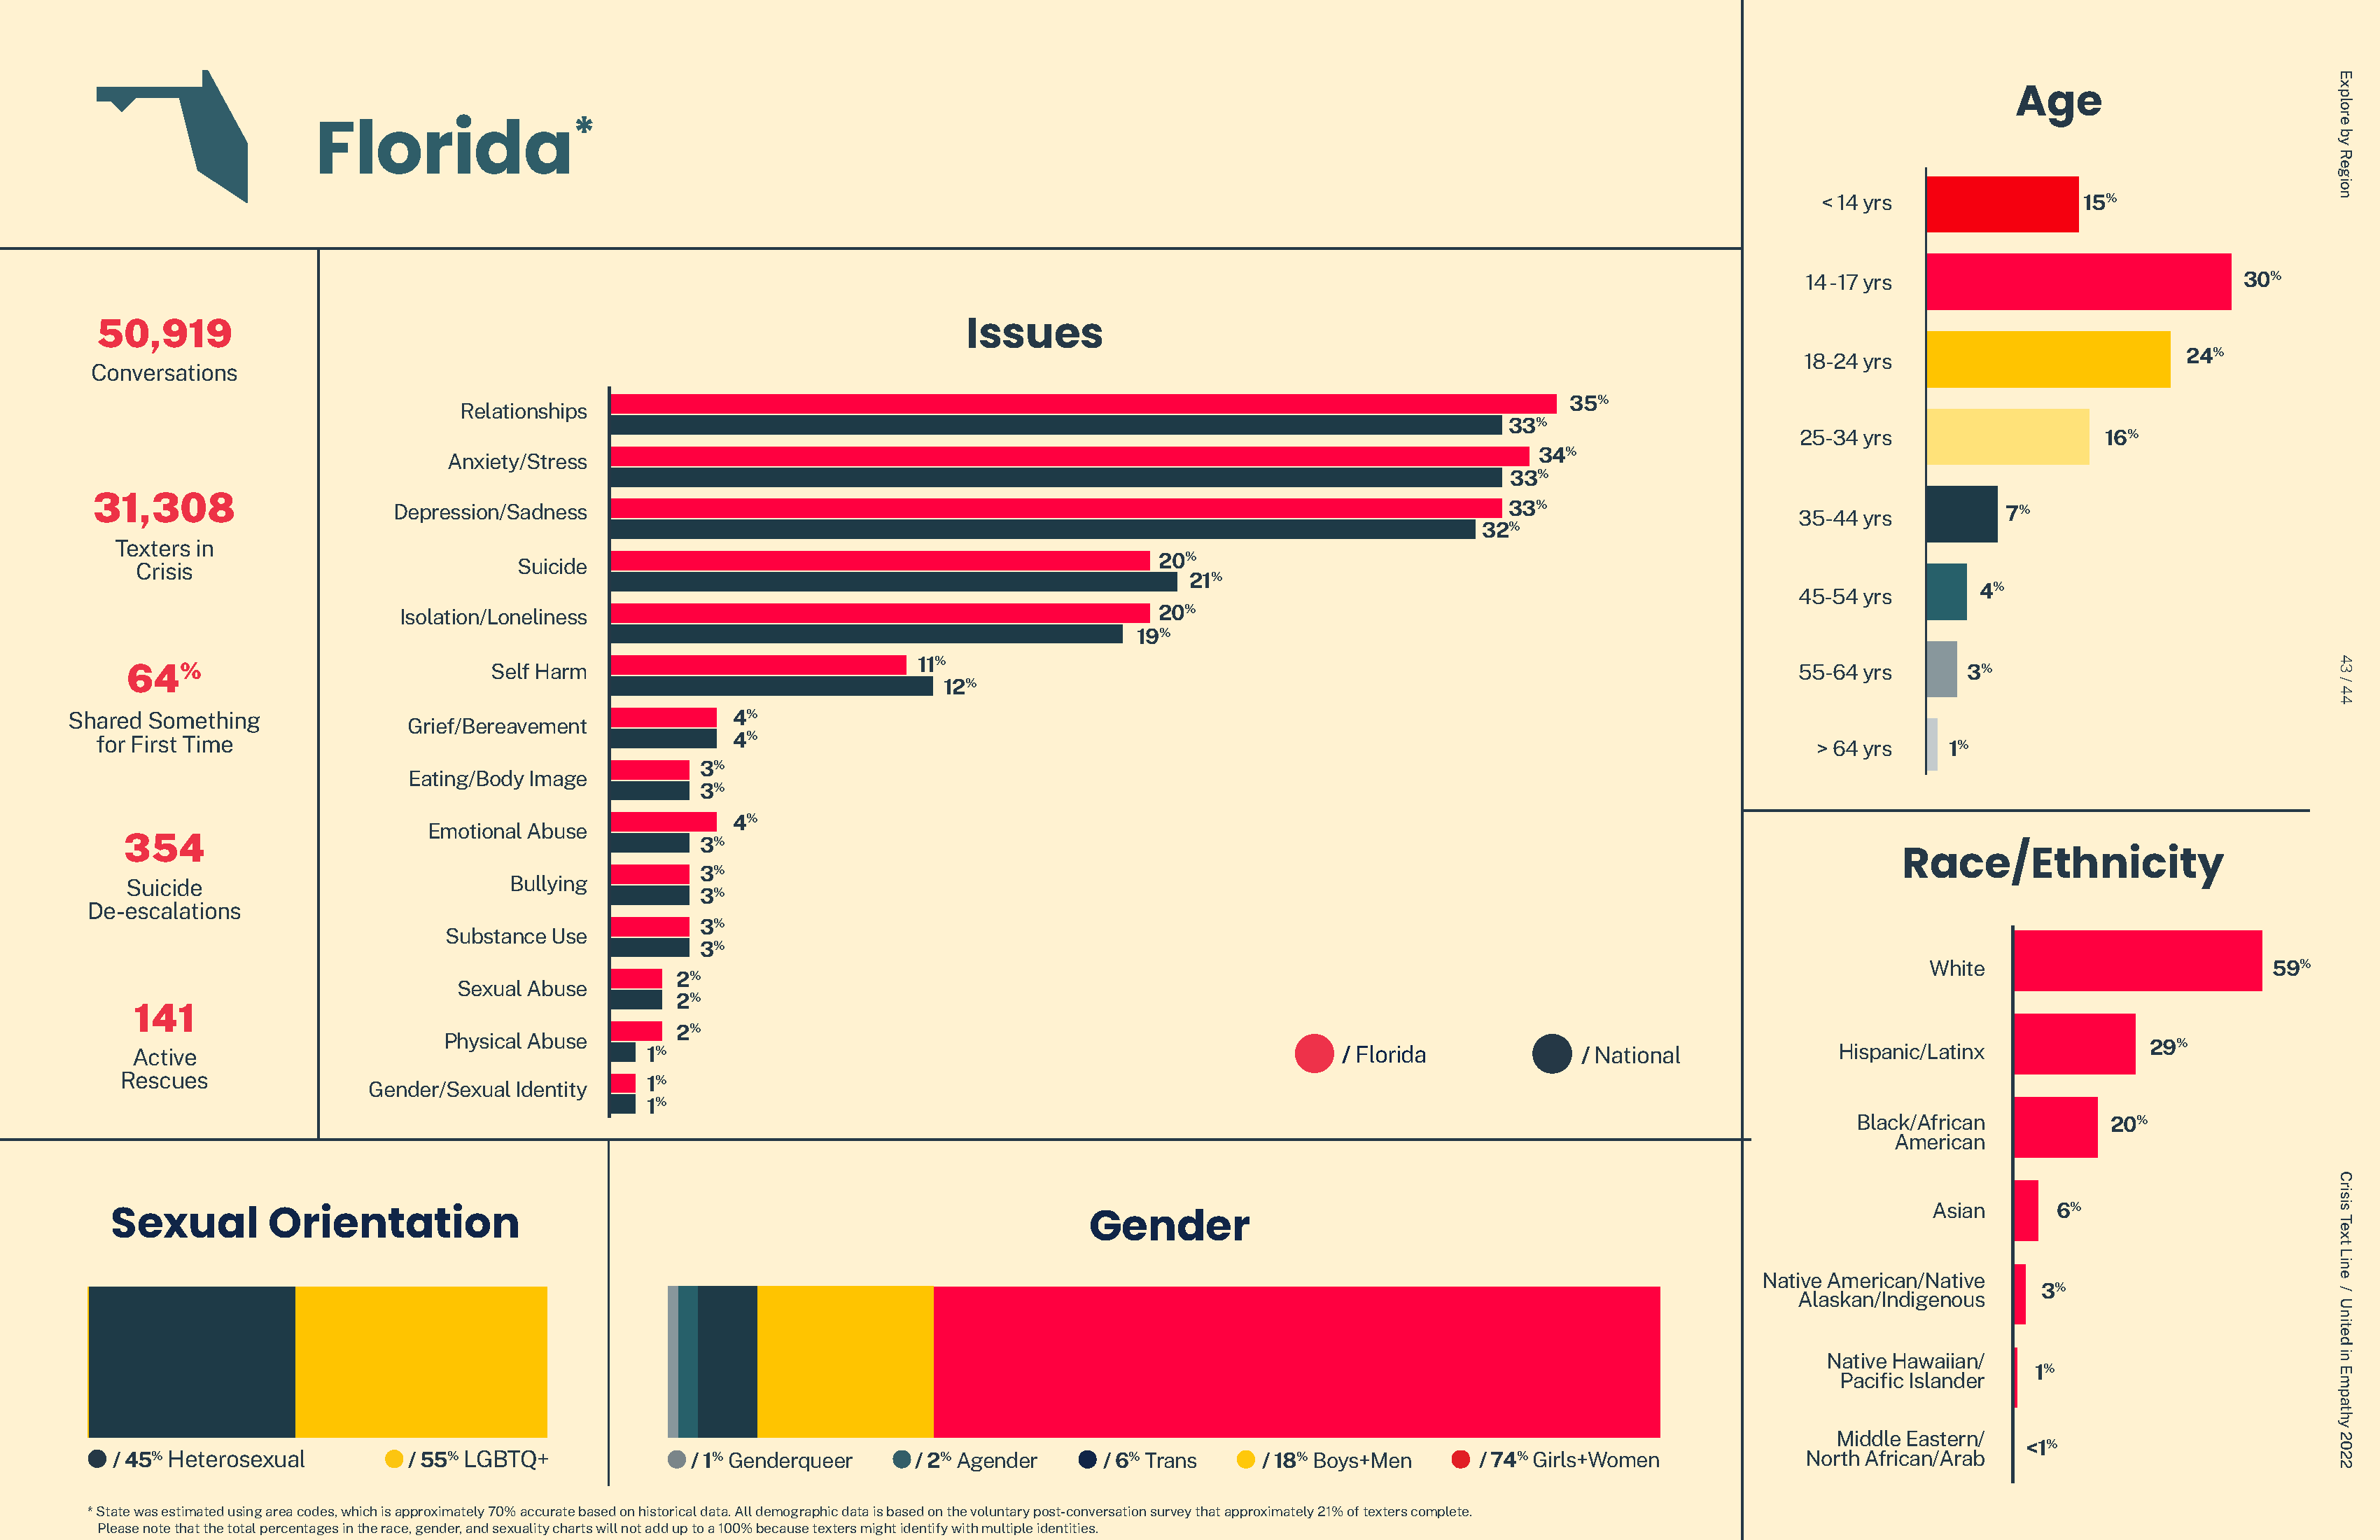
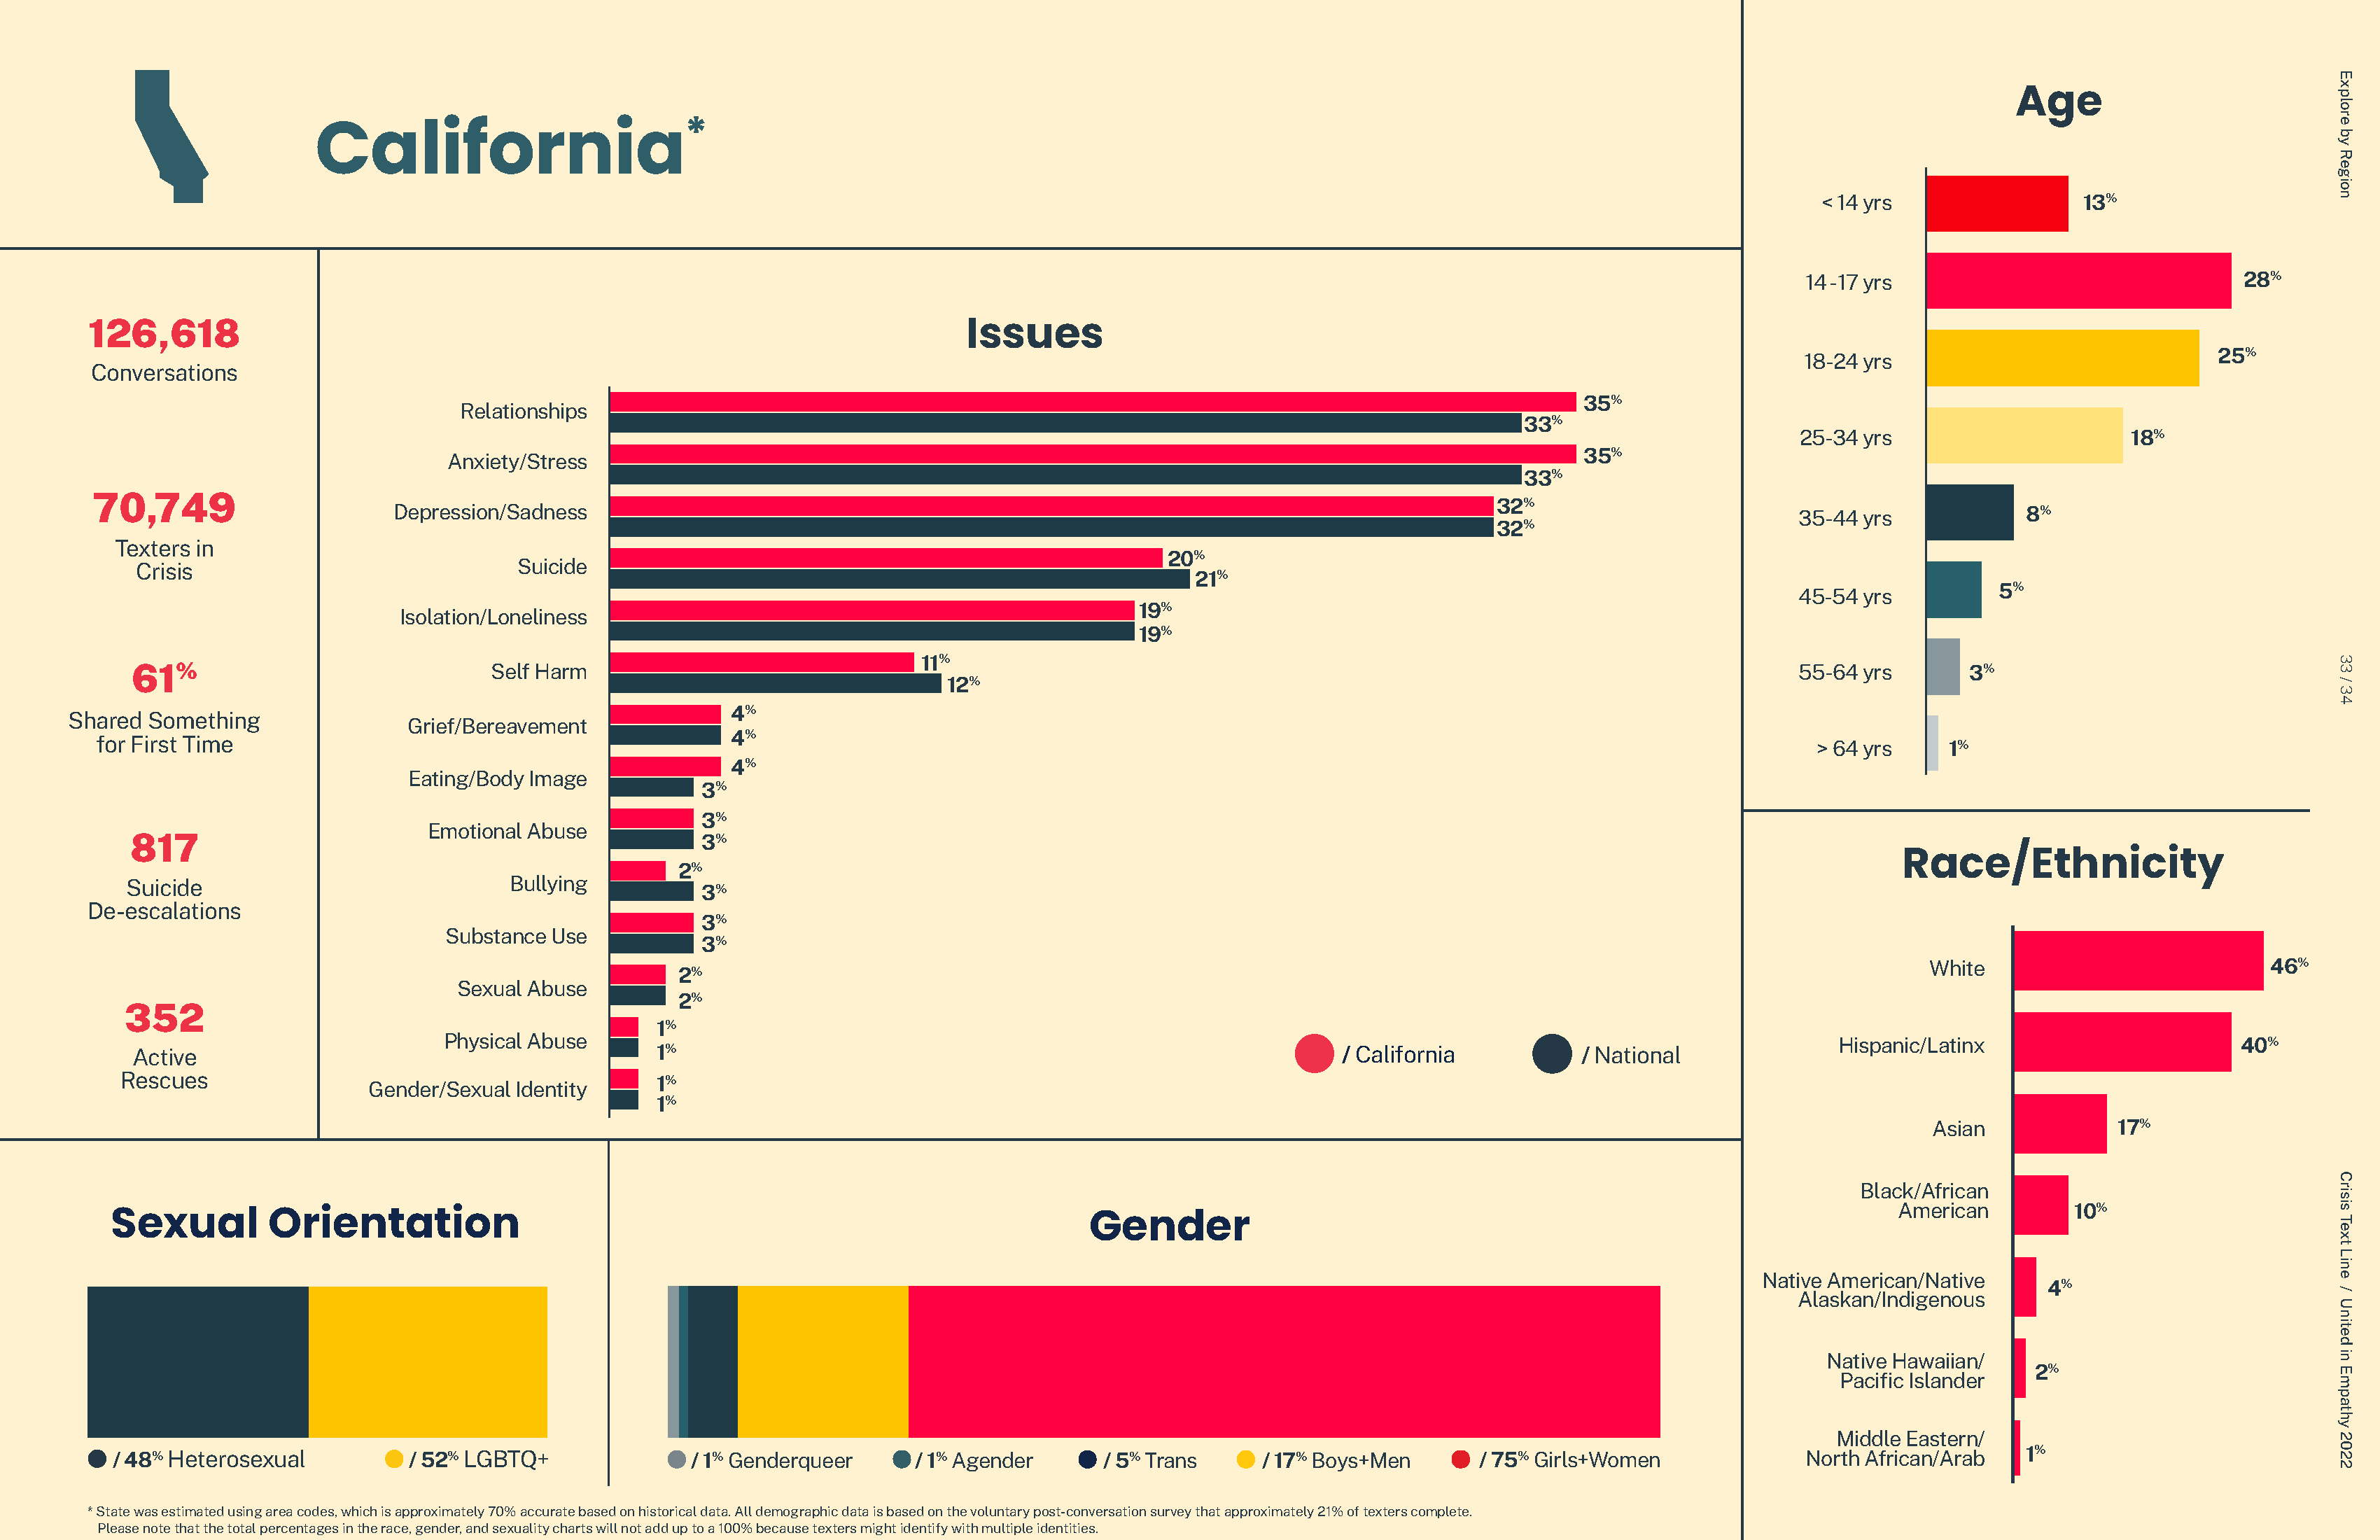
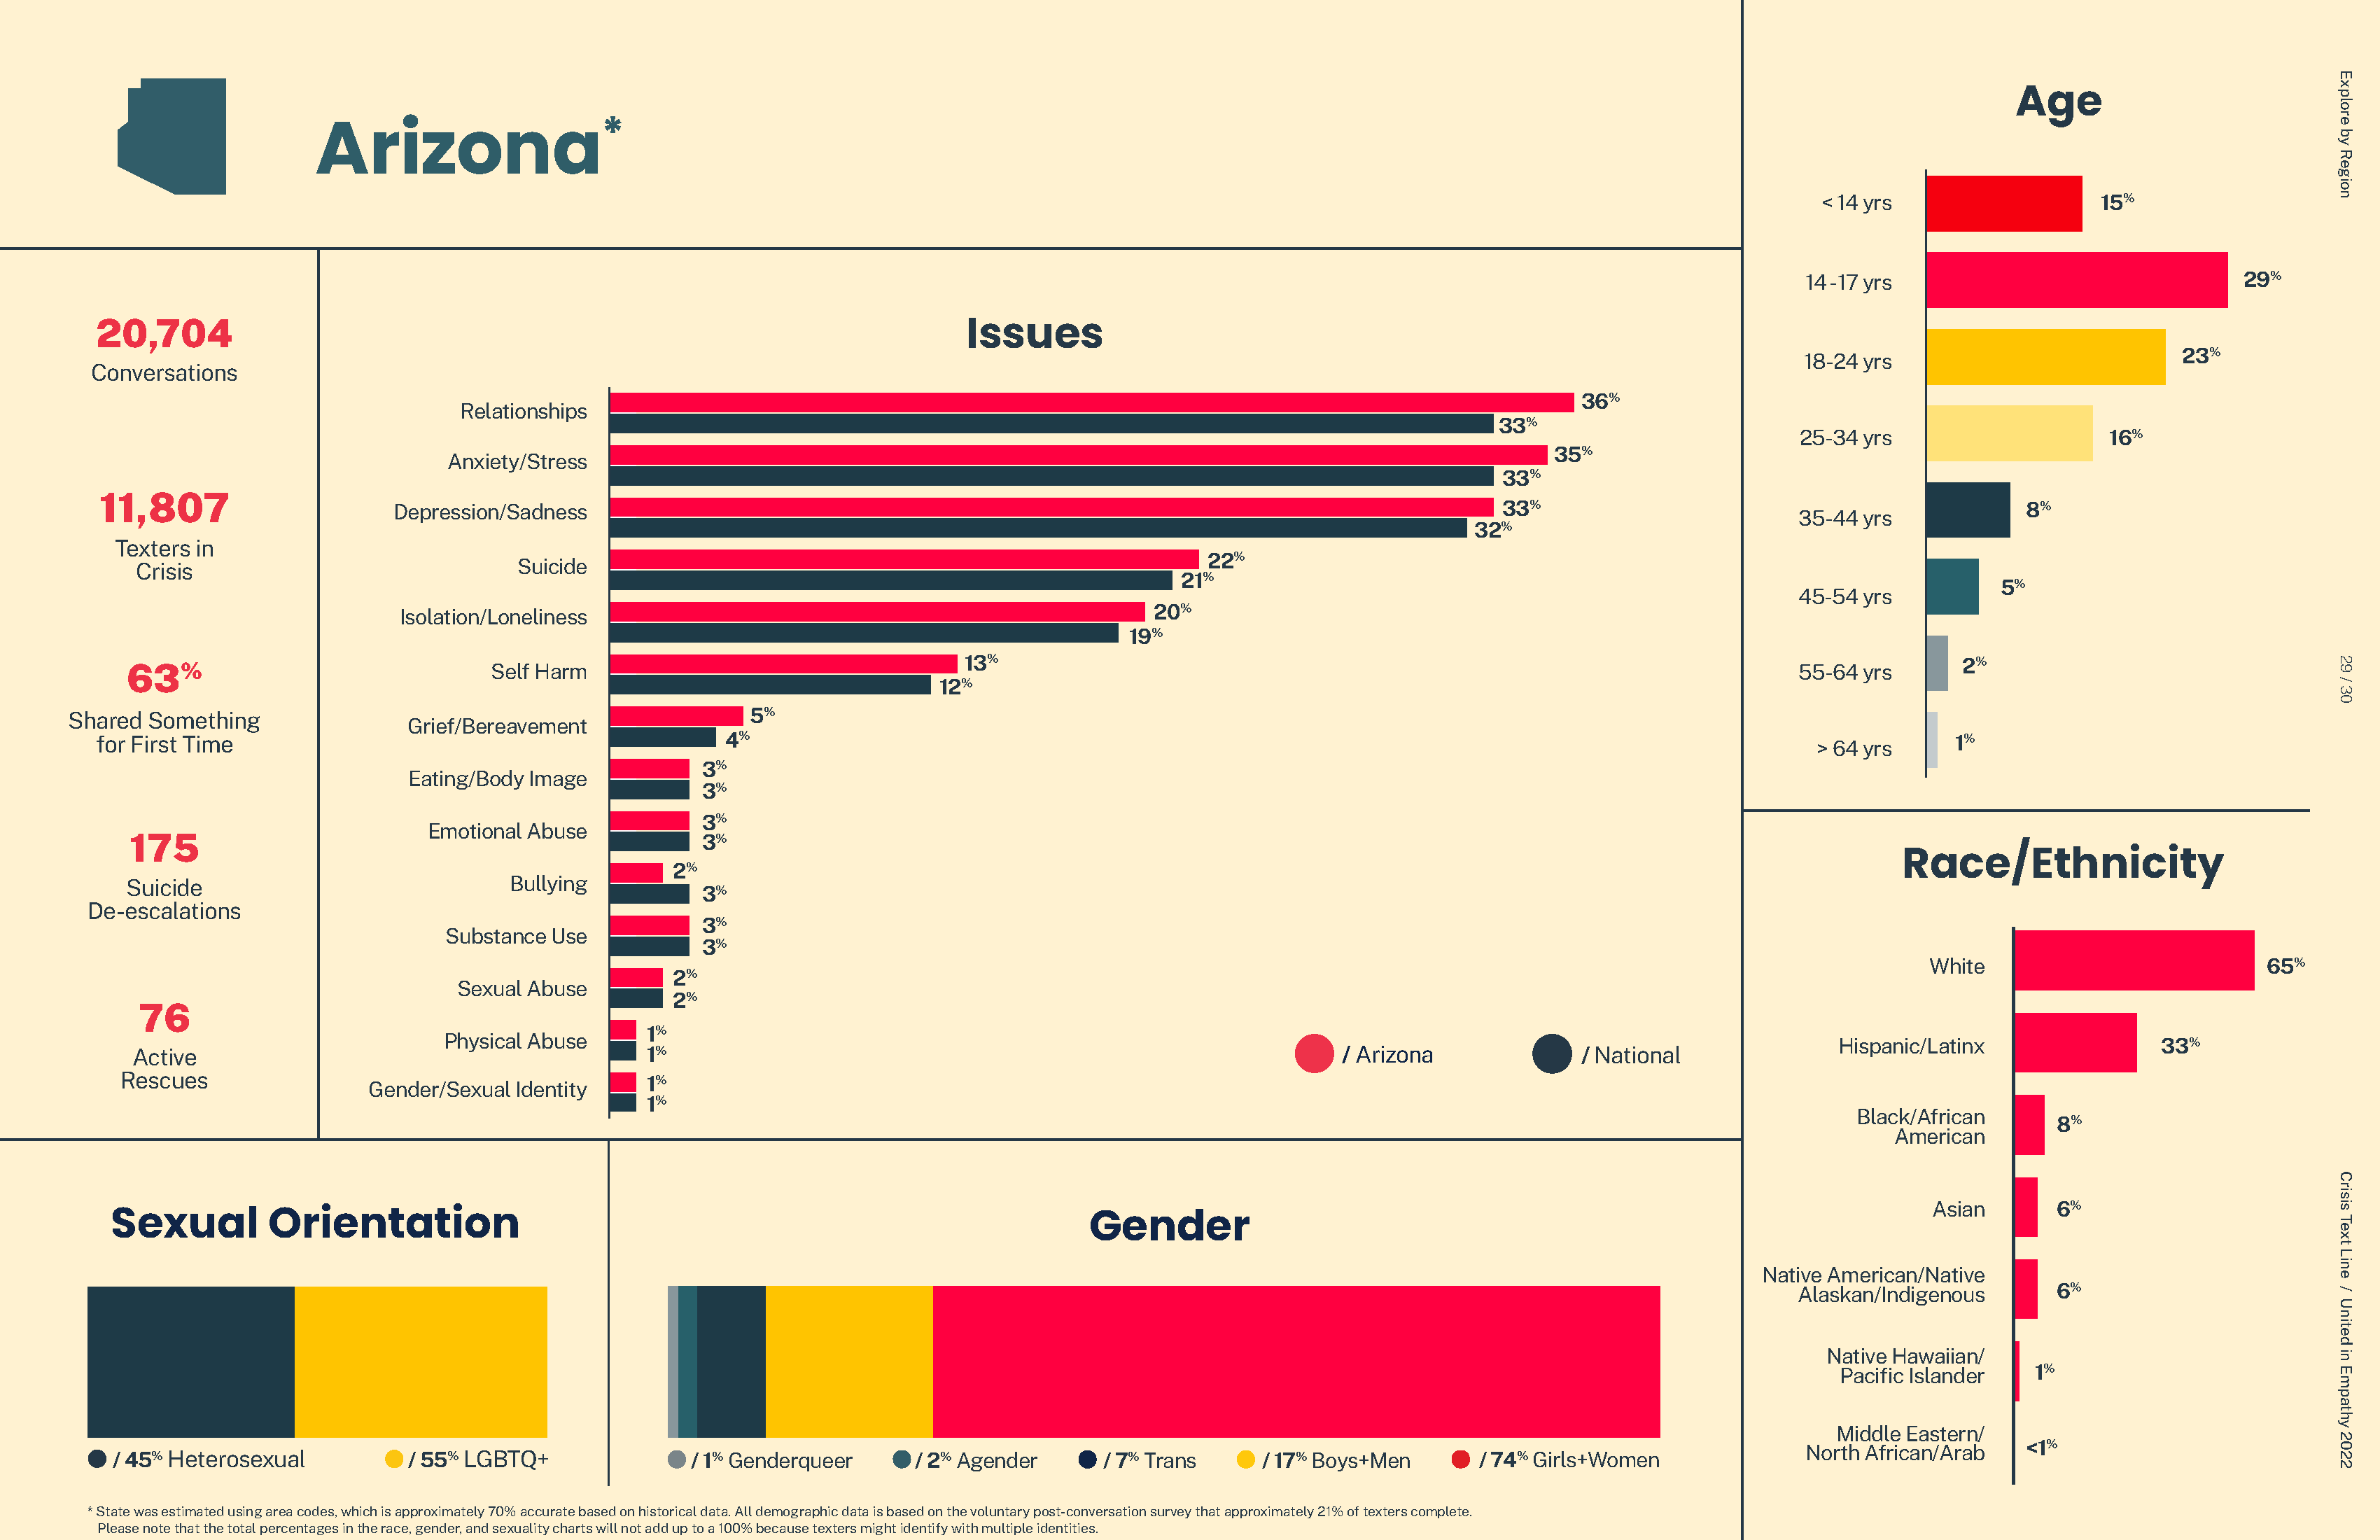
Data visualized across states and demographics.
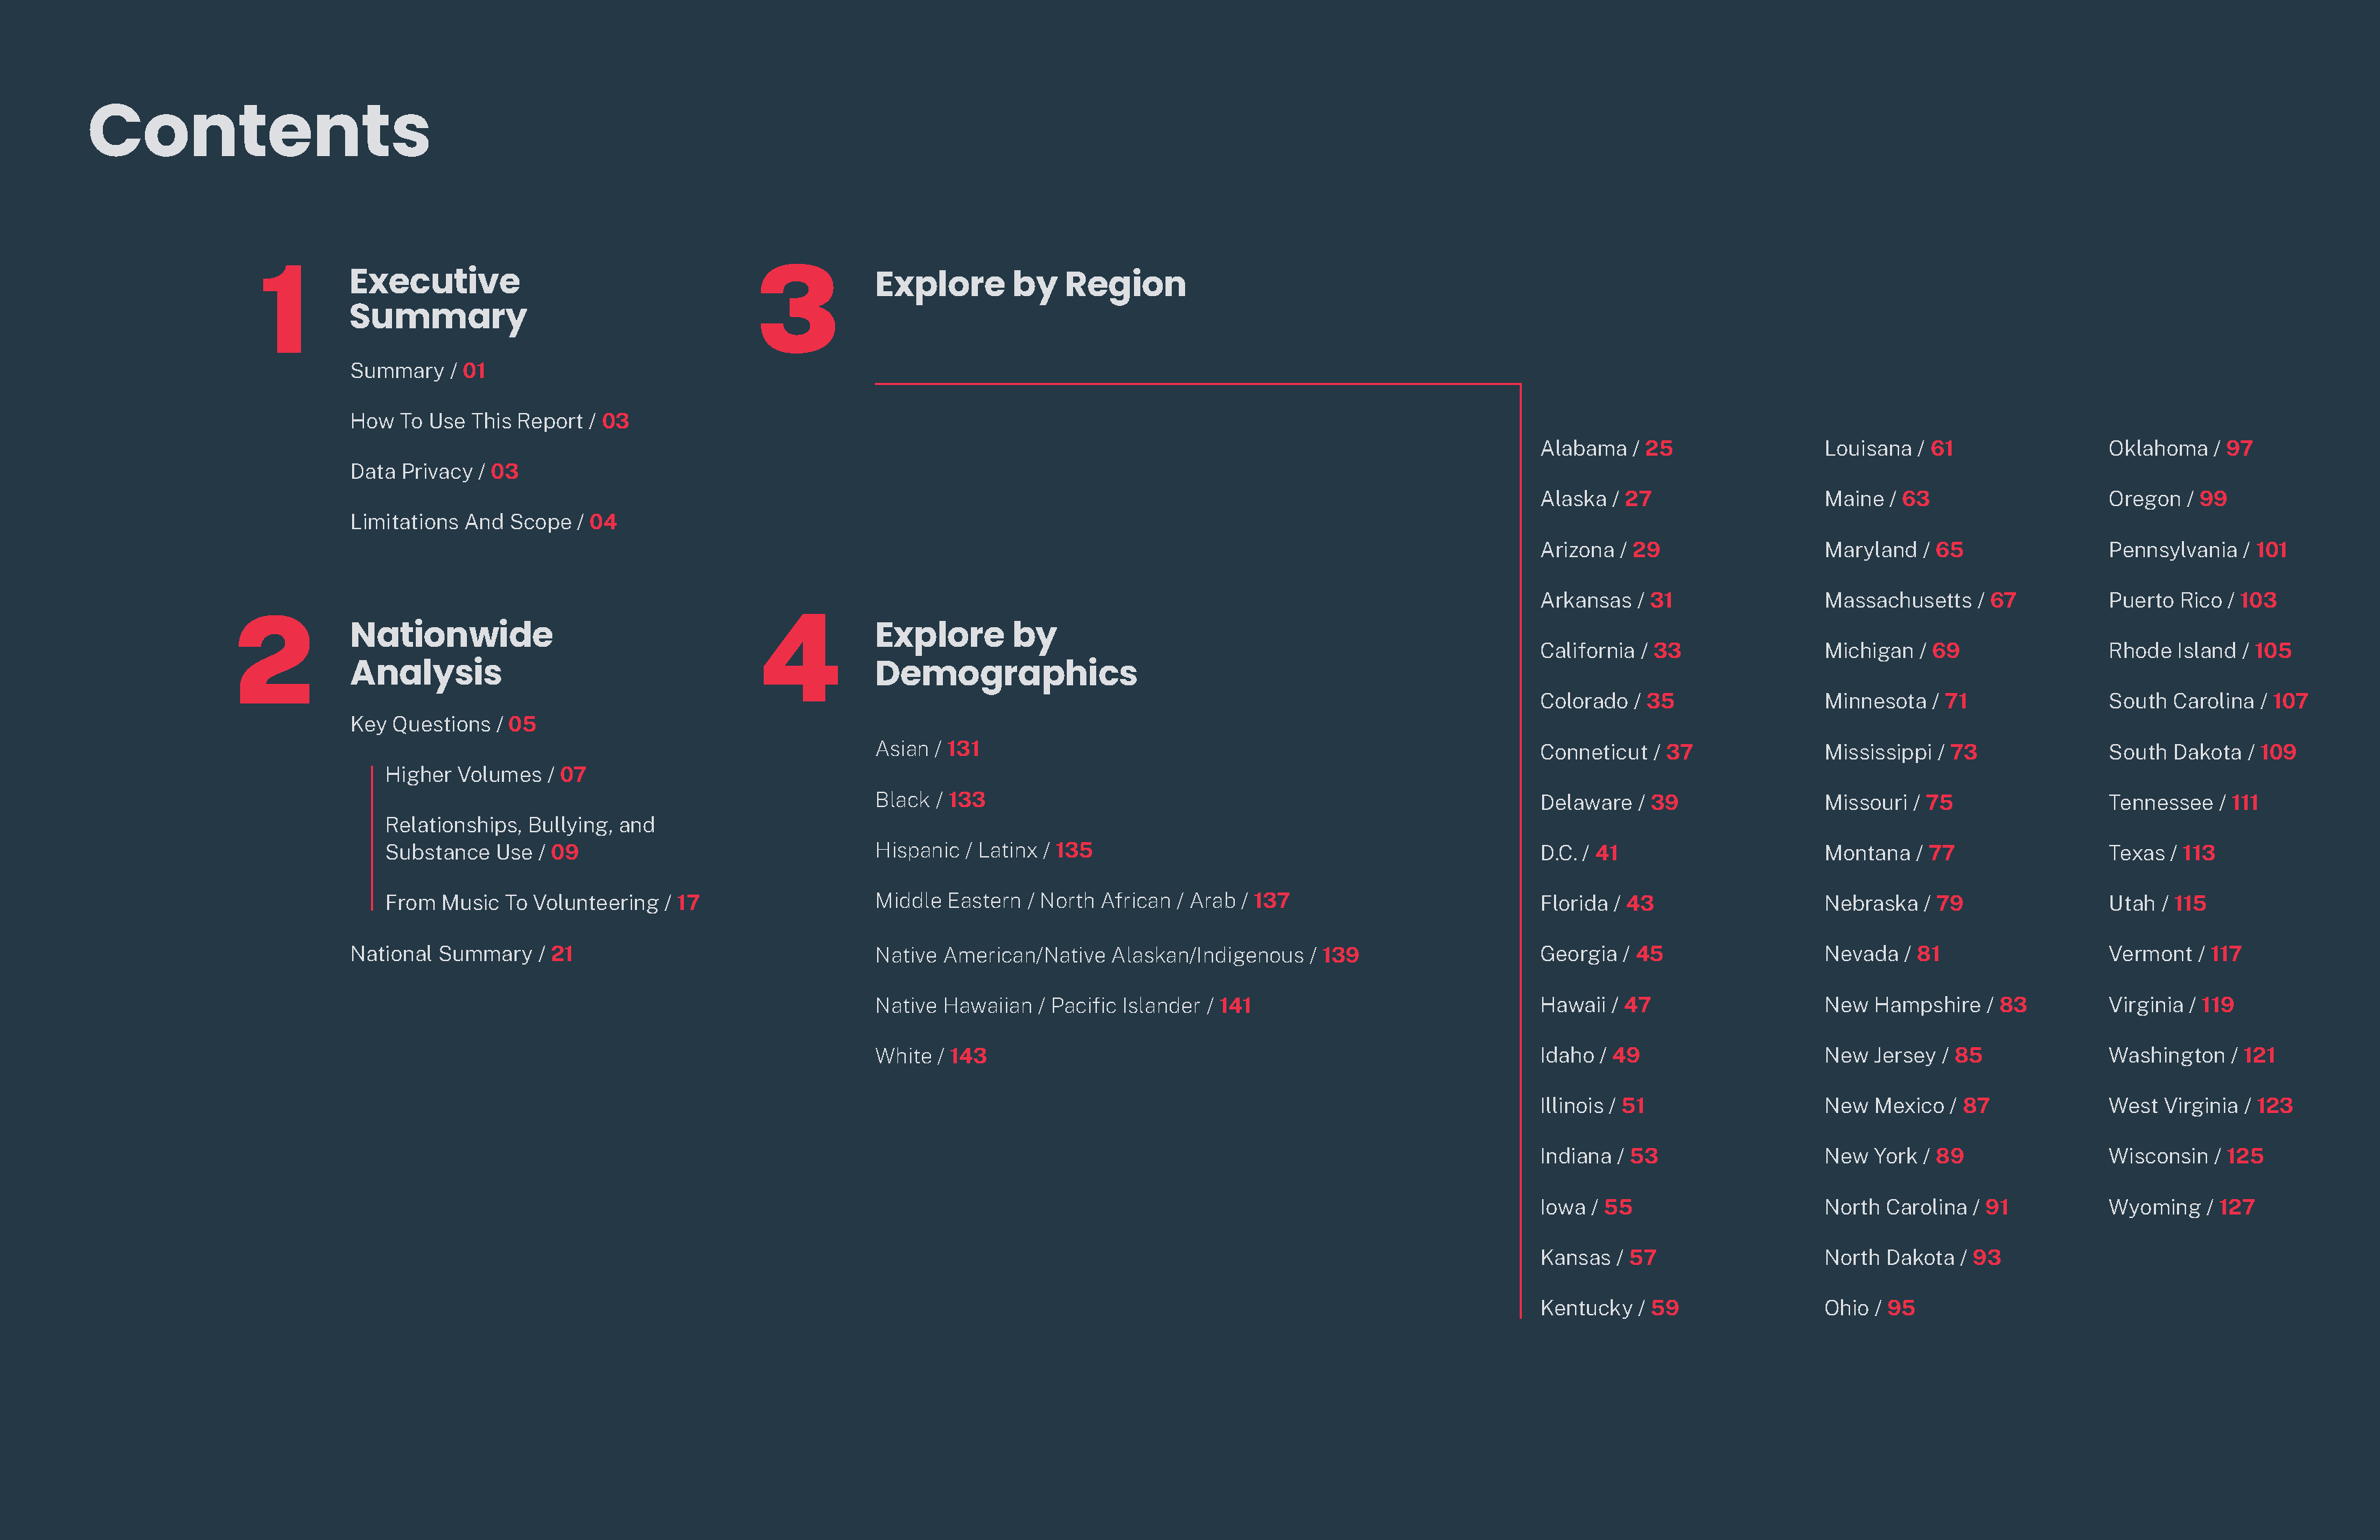
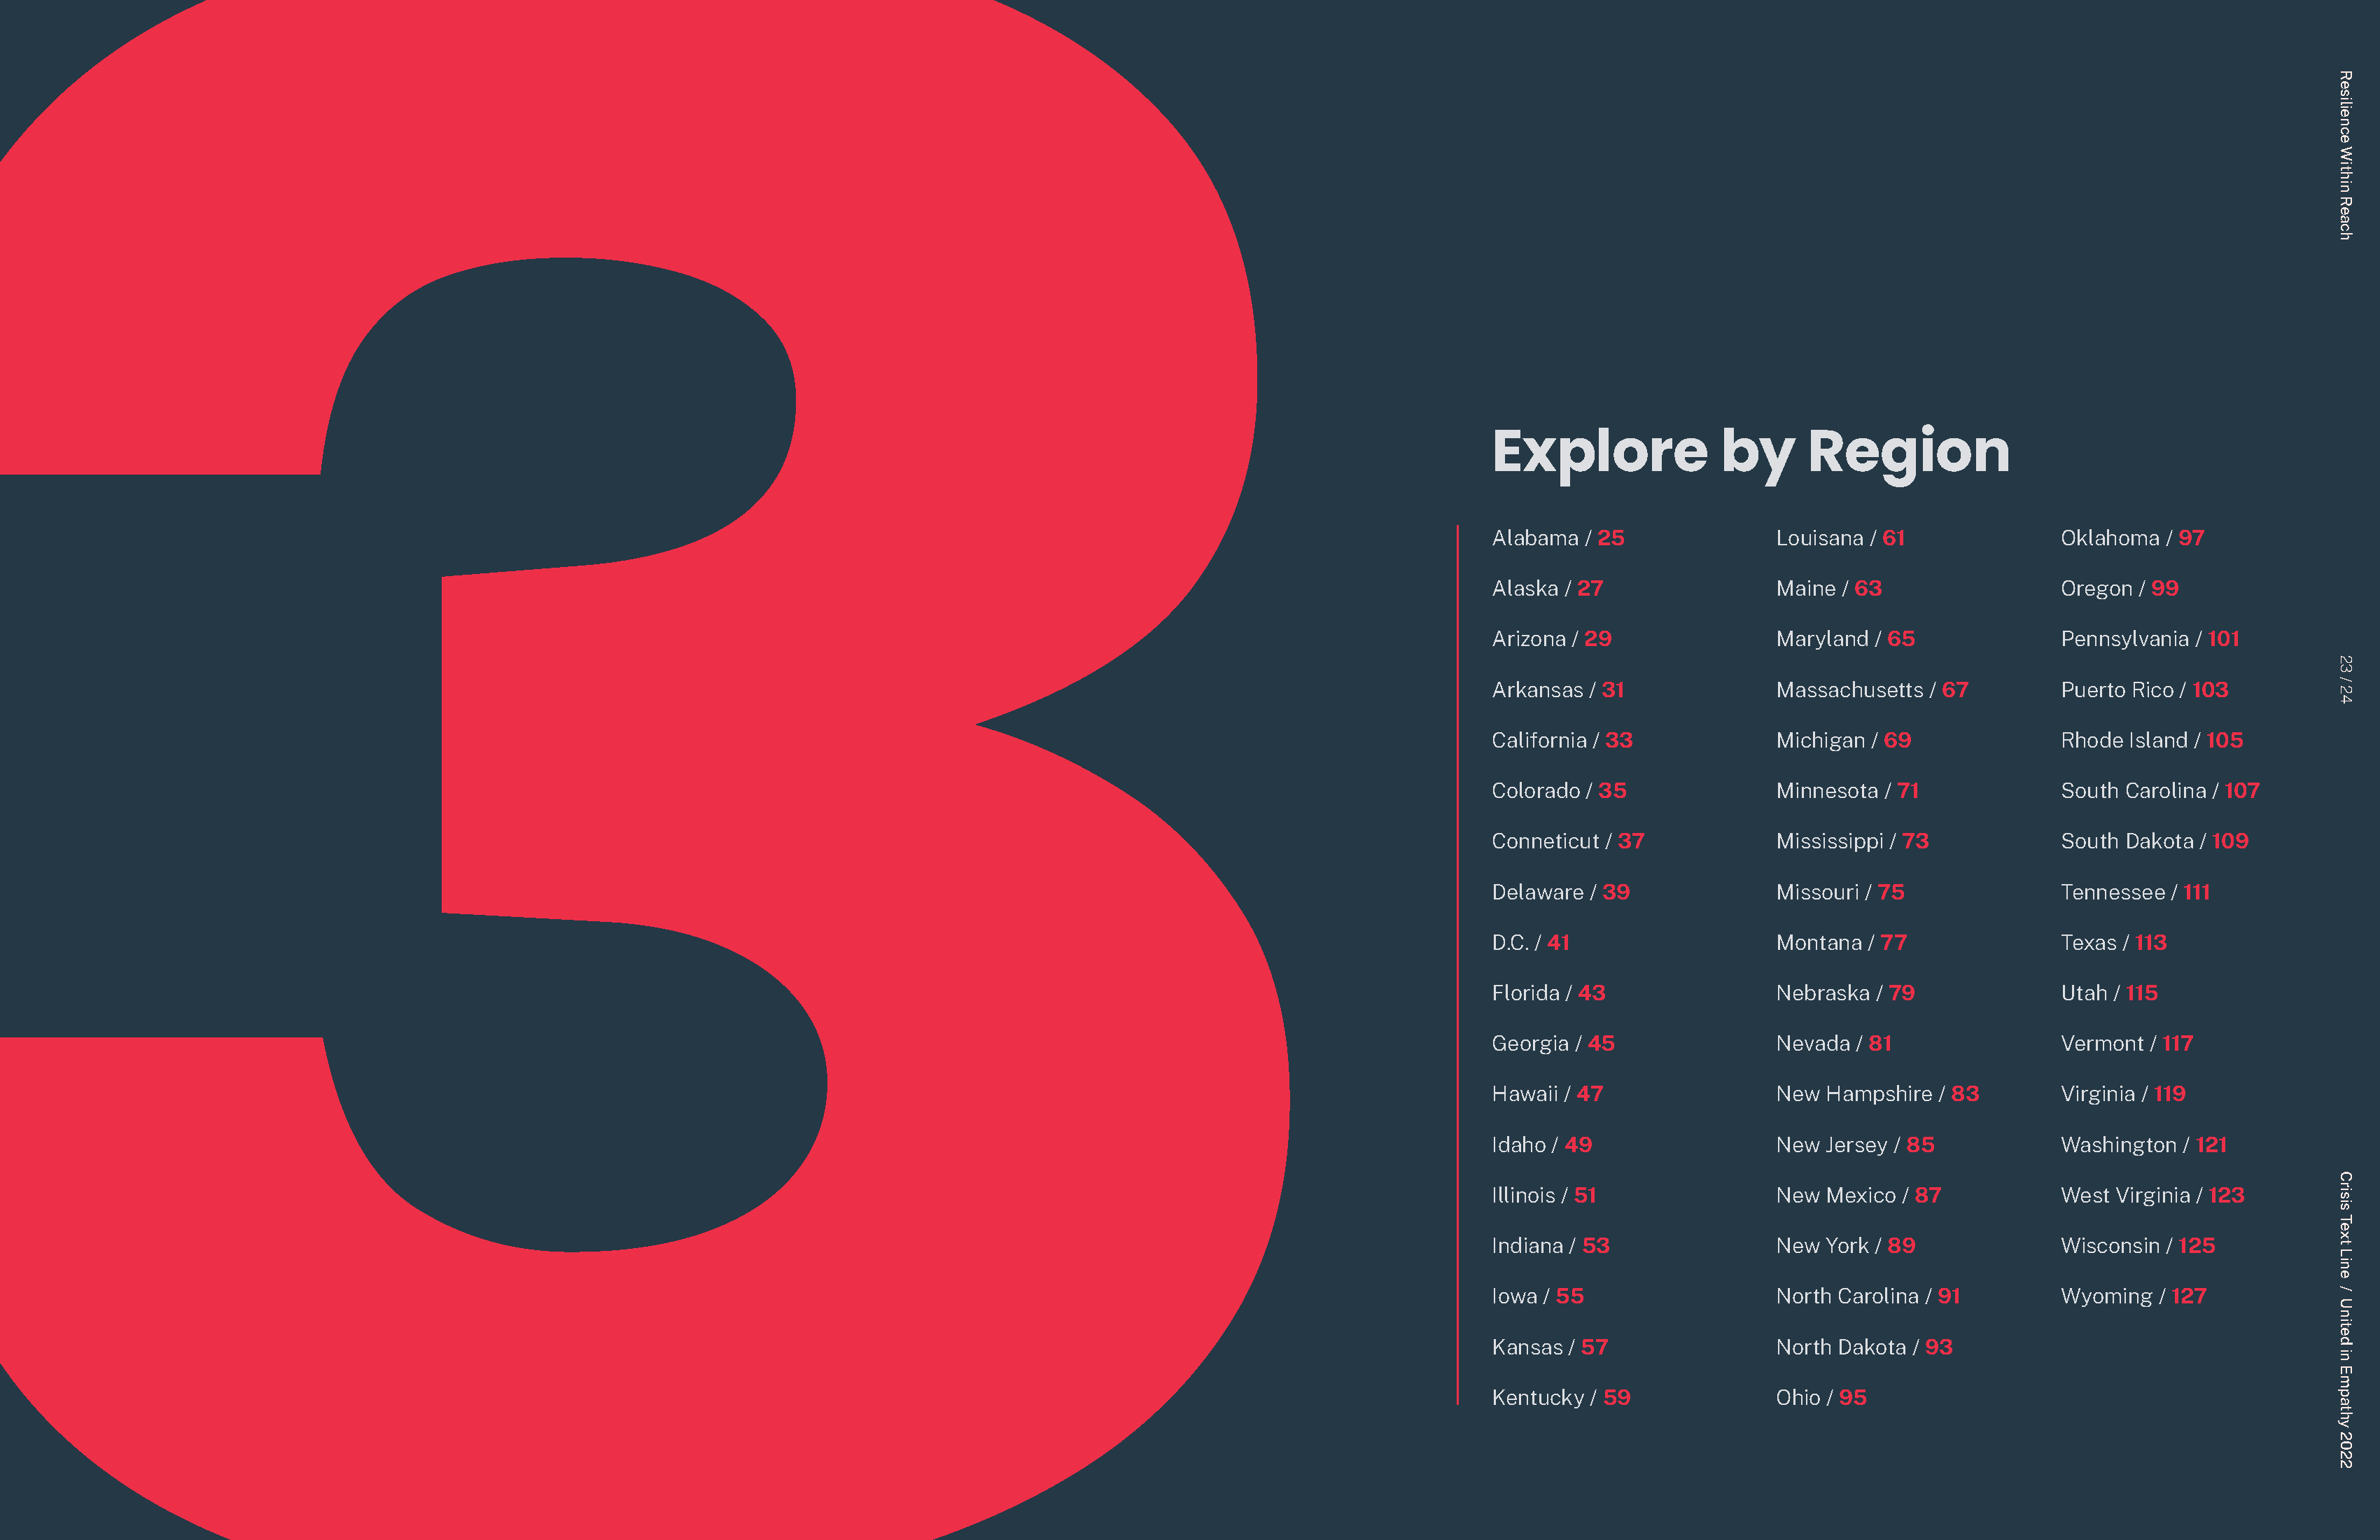
The state-by-state infographics in the report were designed to convey complex regional mental health data in a visually engaging and easily digestible format. Each state was represented with customized graphs that highlighted key statistics and trends unique to that area. The use of color-coding and intuitive icons allowed for quick visual comparisons, helping readers to instantly grasp variations in mental health stressors and coping mechanisms across different states. The design aimed to make the data not only informative but also accessible to a wide audience, ensuring that the significant regional disparities in mental health were clearly communicated.
The design aimed to make the data not only informative but also accessible to a wide audience, ensuring that the significant regional disparities in mental health were clearly communicated. To achieve this, we employed a user-friendly layout with intuitive visuals that simplified complex data, making it easy for anyone to understand at a glance. Each state’s infographic was carefully designed with color-coded sections, bold graphics, and concise text to highlight key statistics and trends, allowing readers to quickly grasp the most important information. By prioritizing clarity and readability, we ensured that the report could effectively reach and resonate with a diverse audience, from mental health professionals to policymakers and the general public, thereby raising awareness about the urgent need for targeted mental health resources and interventions across different regions.
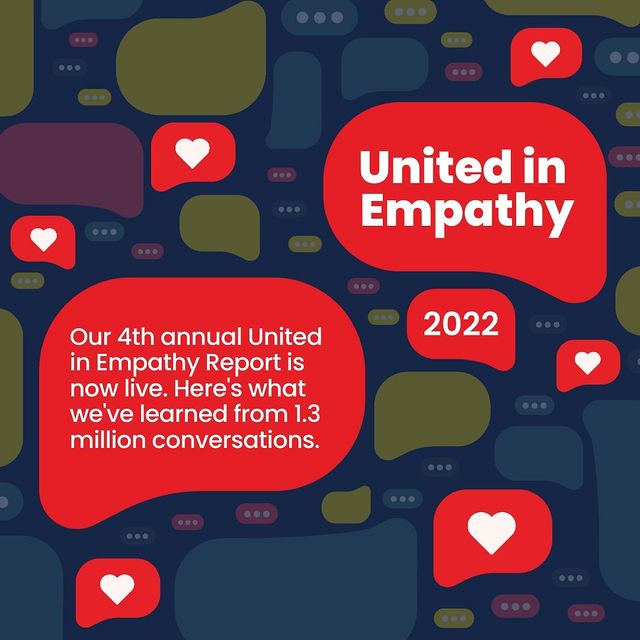
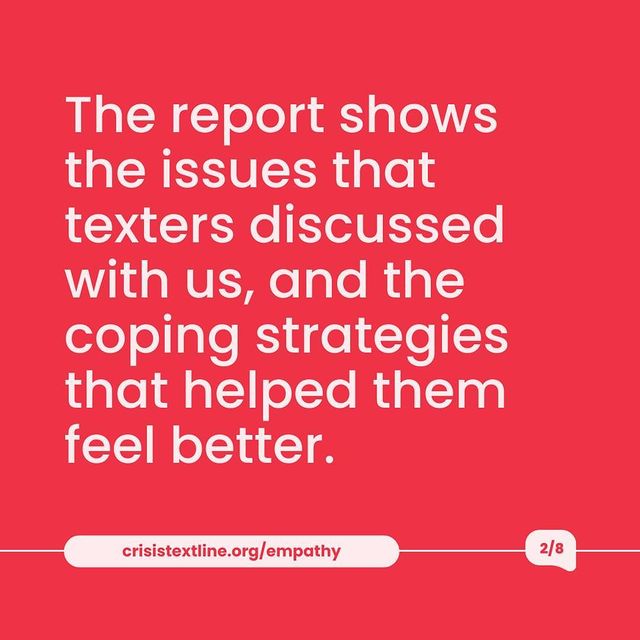
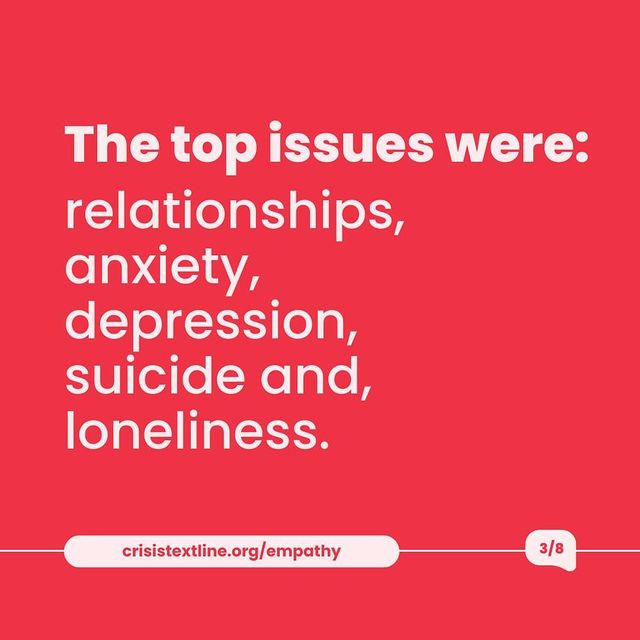
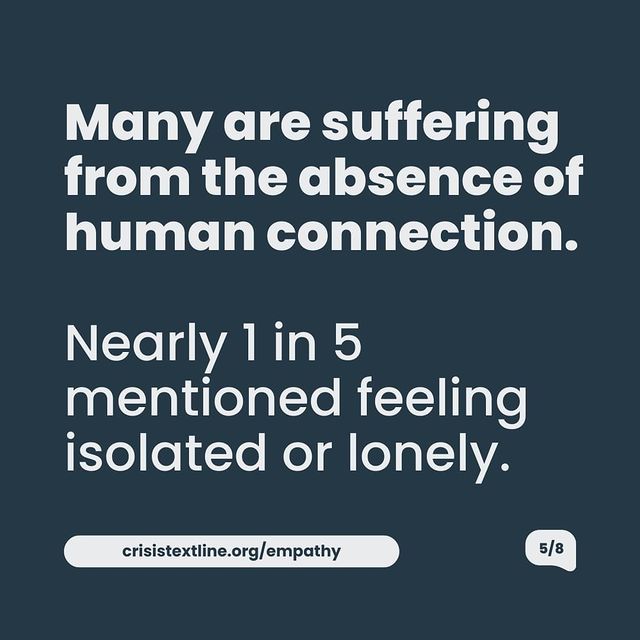
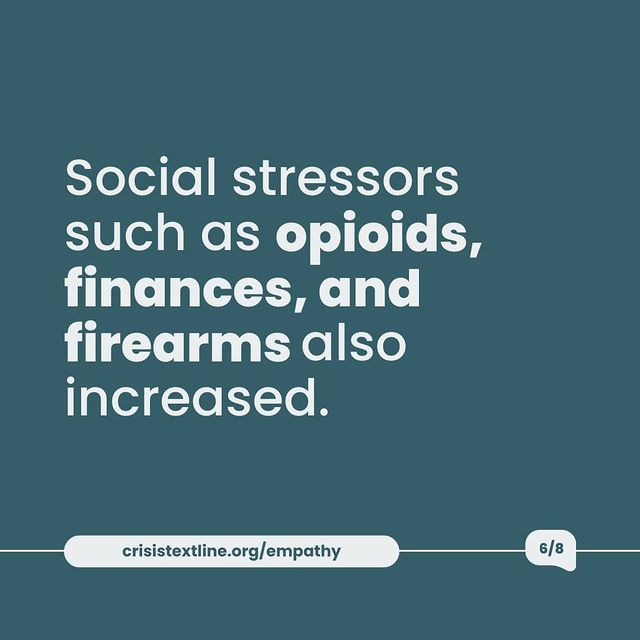
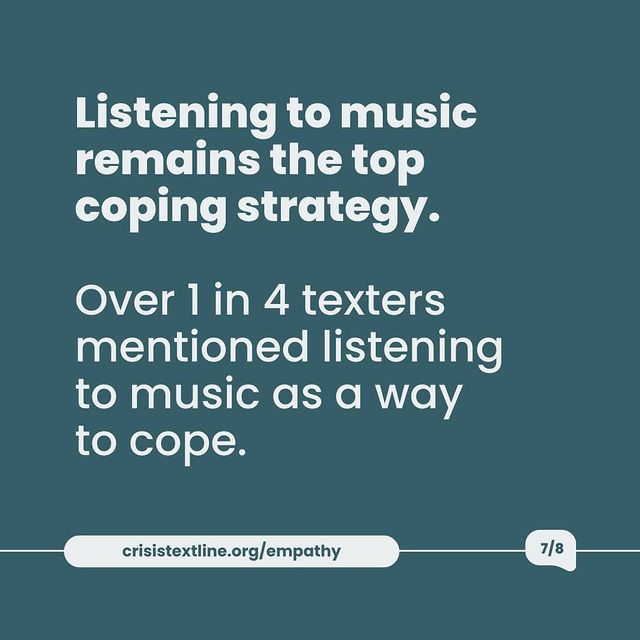
Social media launch promotional tiles.
Impact
The “United in Empathy 2022 Report” stands as a testament to the power of design in communicating critical mental health issues. By combining compelling visuals with heartfelt narratives, the report not only informs but also inspires action and empathy. It serves as a crucial resource for mental health professionals, policymakers, and the public, emphasizing the urgent need for accessible mental health support.
Creating this report was an incredibly rewarding experience. It allowed us to present vital information in a way that is both impactful and compassionate, ultimately contributing to a greater understanding and support for those facing mental health challenges.


